Showing posts with label Demographics. Show all posts

Thursday, March 28, 2019

Where Have All the Young Workers Gone?

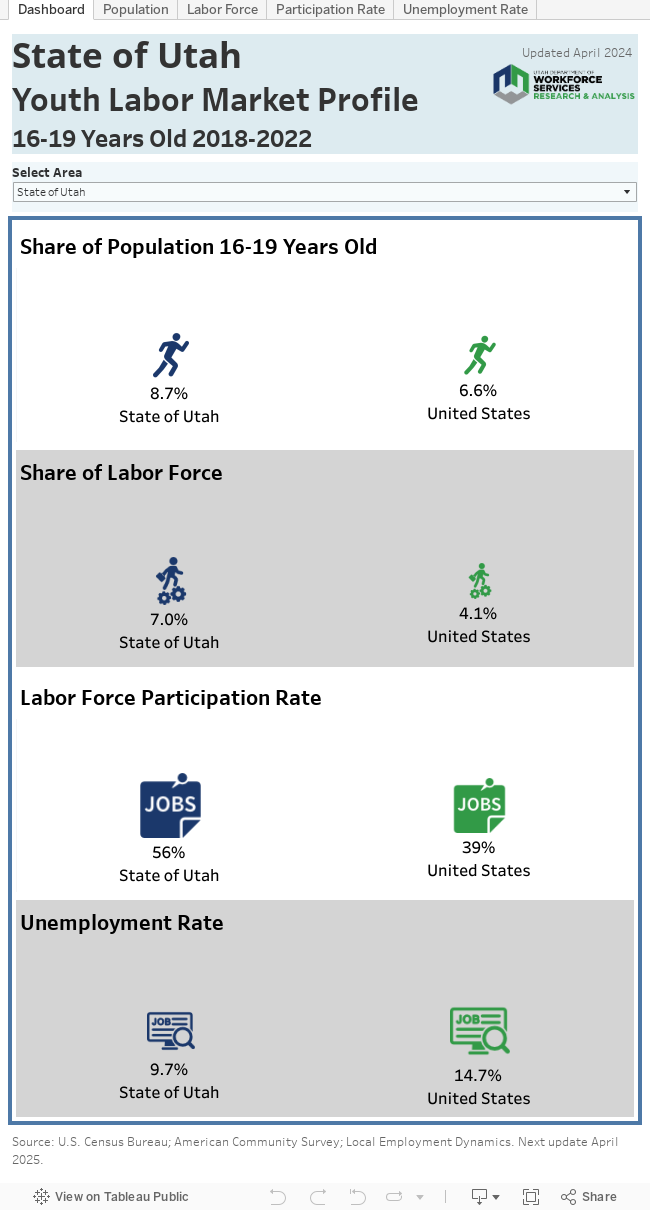
Young workers in Utah and the U.S. comprise a smaller share of the labor force

By Lecia Parks Langston, Senior Economist
 
"We should be trying to reach the young workers because that’s when you’re most idealistic and have least fear."  John Lennon

 
One of the most striking labor market changes of the last decade and a half is the declining participation of teenagers in the labor force. Nationally, teenage participation topped out at almost 59 percent in the late 1970s, and today stands at roughly 36 percent. While the trend isn’t as pronounced in Utah as it is nationwide; here, too, young people are less likely to be employed or looking for work than they were as the century began. The reasons for this phenomena are not clear. However, more after-school activities and increased borrowing to pay for post-secondary education (rather than earning while learning) may factor into this decline.
 
On the other hand, some characteristics of youth workers have changed little. Utah teens still show some of the highest labor force participation rates in the nation. Also, young people continue to show the highest unemployment rates, the lowest wages and the top turnover rates of any age group.
 

Monday, December 4, 2017

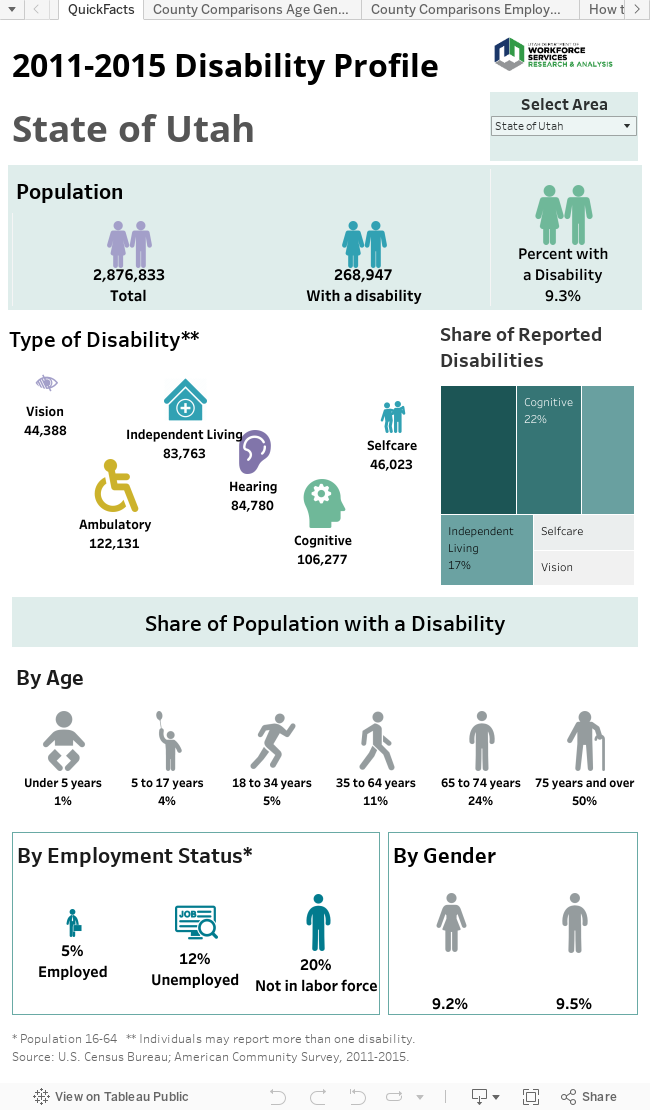
Profiling Utahns with Disabilities


For complete post and narrative, click here.

Thursday, June 1, 2017

Is Your Town Growing?

U.S. Census Bureau releases 2016 City Population Estimates


By Lecia Parks Langston, Senior Economist

“A city is more than a place in space, it is a drama in time” –Patrick Geddes

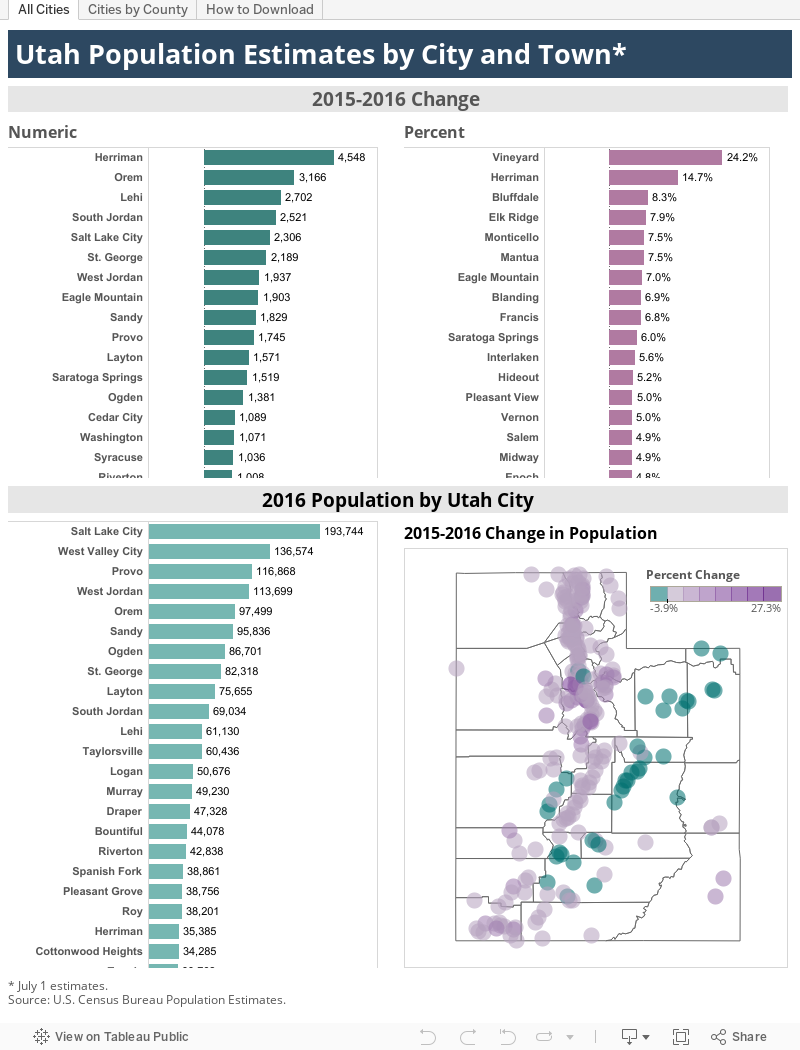
Most of Utah’s cities and towns grew in 2017, according to population estimates recently released by the U.S. Census Bureau. Lehi even ranked 11th among the nation’s fastest-growing large cities. However, not all Utah’s cities and towns experienced growth.

Use the visualization and bullet points below to explore population trends for individual townships.


• The old Geneva Steel Mill site continues to be fertile ground for population expansion. Vineyard was once again the fastest growing city in Utah. However its rate of growth has slowed dramatically since 2015. In addition, Vineyard remains relatively small in size.

• Herriman added the highest number of new residents of any city in Utah (4,550) followed by Orem, Lehi and South Jordan. All showed higher population gains than Salt Lake City — Utah’s most populous city. Herriman also showed the second-fastest rate of expansion in 2016.

• St. George was the only city outside the Wasatch Front to increase its population by more than 2,000 residents.

• The top four population-gaining cities in Utah are all located in southern Salt Lake County or northern Utah County, as the metropolitan population continued to spread outward from the large city centers. Fastest-growing larger communities also tended to be located near the Salt Lake County/Utah County border.

• Due to the nature of percent-change mathematics, several small towns (such as Monticello, Mantua, Francis, Interlaken and Hideout) showed high growth rates although their new-resident counts measured relatively low.

• The Census Bureau estimates that most of the cities and towns showing population declines were located in the Uintah Basin, Carbon County and Emery County. Declines in resource-based employment have spearheaded these population declines.

• In addition, Millard, Piute, Garfield and Wayne counties displayed a significant number of contracting townships.

• Salt Lake County remains home to five of the 10 largest cities in the state. Utah County accounts for another two in the top 10. St. George is the only city in the top-10 ranking located outside the Wasatch Front.

Thursday, April 27, 2017

Census Bureau Tool Provides Labor-Force Insight for Utah


By Mark Knold and Lecia Langston

Across the United States, jobs are quantified through each state’s unemployment insurance program. Those programs provide the potential for laid-off workers to receive unemployment benefits — the goal being to bridge the gap between workers’ lost jobs and their next jobs. An eligible recipient’s weekly benefit amount is based upon their earnings from recent work. This begs the question, how does Utah’s unemployment insurance program know how much an individual recently earned while working?

That answer is supplied by all businesses that hire workers, as they must report their employees and pay as mandated by the unemployment insurance laws. Companies identify their individual workers and those workers’ monetary earnings for a calendar quarter. As businesses are identified by their industrial activity and geographic location, it is through the unemployment insurance program that aggregate employment counts by industry and location are calculated.

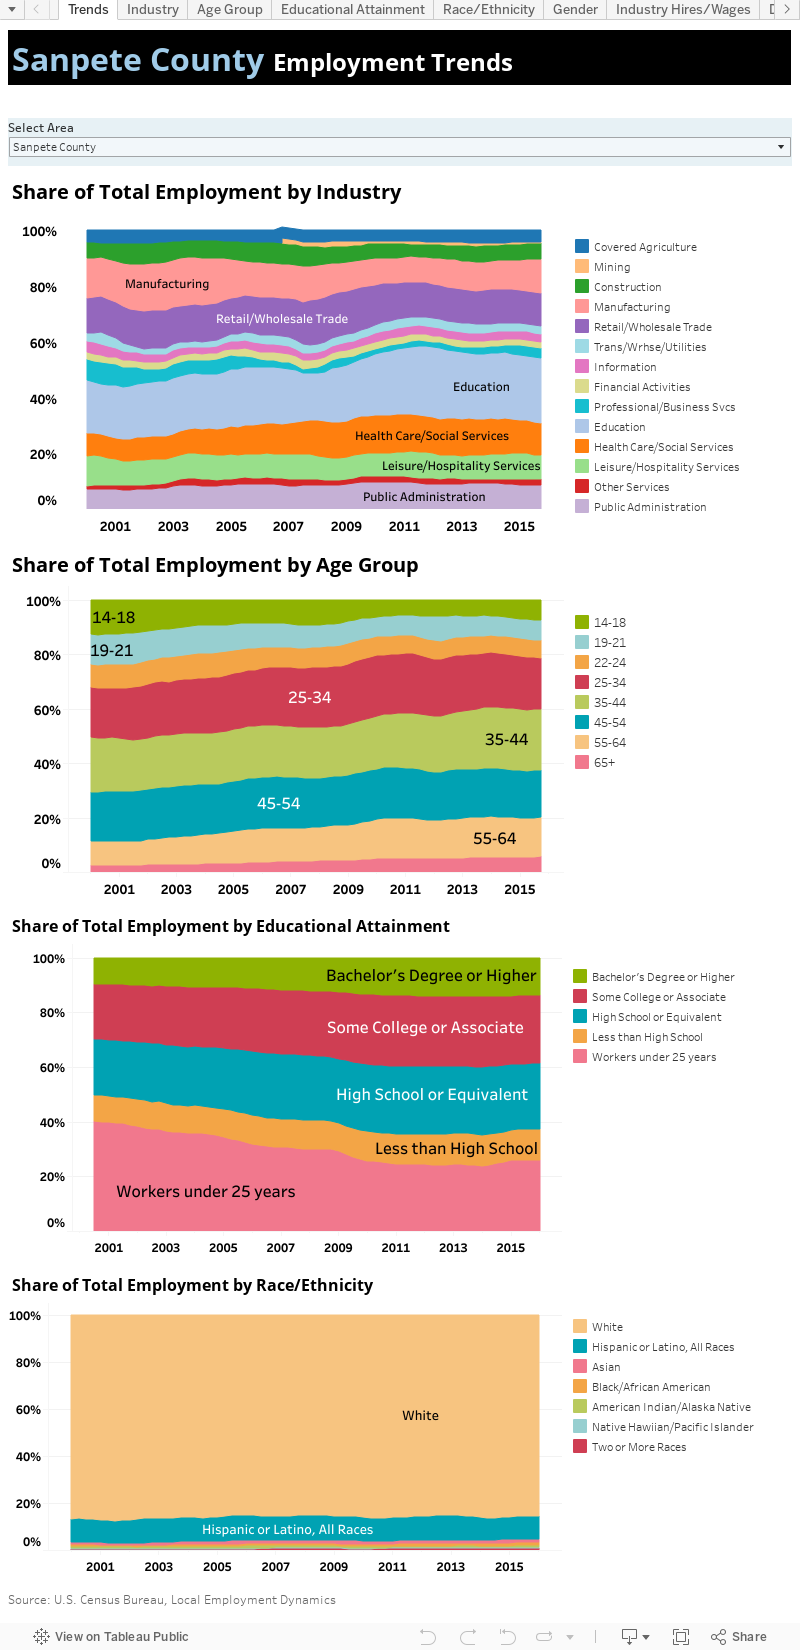
Yet each state’s profiling of individuals is quite minimal in the unemployment insurance program. The U.S. Census Bureau can bring more light to the overall labor force by supplementing said information with gender, age, race/ethnicity and educational attainment (imputted from American Community Survey responses) for Utah’s labor force.

The Census Bureau packages this information through their Local Employment Dynamics program and makes available said data on its website. Here at the Department of Workforce Services, we recently downloaded and packaged Utah-specific data from said website and summarized it in the attached visualization.

Various data “tabs” are available, presenting Utah’s economy from different angles, ranging from industry shares within the economy to the age-group distributions of the labor force, to gender and race distributions. These labor variables can be viewed for the state as a whole, or by each individual county.


Health Insurance: Who’s covered in Utah?

Census Bureau Estimates Provide Answers about Utah Health Insurance Coverage


By Lecia Parks Langston, Senior Economist

“Most Americans want health insurance.” Jacob Lew

The U.S. Census Bureau just published its Small Area Health Insurance Estimates (SAHIE) for counties and states while the national discussion on health care laws receives renewed attention. Is this a coincidence? Yes, but a timely one. This post examines how health insurance coverage for Utahns has changed and also the demographics of who has coverage and who does not.

Tracking Utahns Under 65 Years of Age

Small Area Health Insurance Estimates cover the population under 65 years of age. Of course, virtually all residents 65 and older are covered by government-provided Medicare. Because the estimates date back to 2008, two years before the signing of the Affordable Care Act (ACA), the available figures provide an indication of the effect of the ACA on health insurance coverage in Utah and its counties.
More Utahns have Health Insurance

Between 2008 and 2015, the number of Utahns under 65 years old covered by health insurance increased by 284,000. Not only did the actual covered increase, but the share of non-senior population with health insurance also gained ground expanding from less than 84 percent to more than 88 percent — an increase of 4.7 percentage points.

Only Millard County experienced a very slight 0.3 percentage point decline in health insurance coverage although the actual number of persons covered increased by 113. Daggett, Rich, Kane and Grand counties showed the highest growth in under-65 coverage; each showed increases of at least 9 percentage points.

In 2015, counties in northern Utah generally showed the highest level of non-senior health insurance coverage. In Morgan, Davis, Box Elder, Tooele and Cache counties, health insurance rates top 90 percent. On the other end of the scale, rural counties in central and southern Utah display the lowest coverage. In San Juan, Millard, Duchesne and Wayne counties, health insurance rates for those under 65 measured 83 percent or less.

Those under 19 saw the greatest gains. Coverage rates for these young people increased from 87 percent in 2008 to 93 percent in 2015. Utah males experienced a larger gain in coverage between 2008 and 2015 (5 percentage points) than did females (4 percentage points), although females were more likely than men to carry health insurance in both years. Health insurance rates for those with the lowest incomes showed the most improvement (10.4 percentage points). However, their coverage shares remain roughly 10 points below average.

Wait, There’s More…

Monday, May 23, 2016

Some Central Utah cities lost population during 2015

The U.S. Census Bureau releases 2015 population estimates for cities 

By Lecia Parks Langston, Senior Economist 

“I come from a small town whose population never changed. Each time a woman got pregnant, someone left town.” Michael Prichard

The U.S. Census Bureau just released 2015 population estimates for cities and towns. In the visualization below, you can check out the estimates for your own Utah hometown. Use the “Cities by County” tab to easily locate a particular township.


While most cities in Utah expanded during 2015, they presented a wide variety of growth experiences.

• The old Geneva Steel Mill site has proved fertile ground for population growth. Vineyard, Utah, which is located on the spot, grew by a whopping 418 percent in just one year. However, Vineyard’s population remains relatively low in the overall scheme of things with about 3,200 residents.

• South Jordan added the largest number of persons (roughly 3,800) of any Utah city or town. South Jordan also ranked fifth in the nation for 2015 population growth (among cities with populations of 50,000 or more).

• The top five population-gaining cities in Utah are all located in southern Salt Lake County or northern Utah County as the metropolitan population continues to spread outward from the large city centers. Fastest-growing larger communities also tended to be located near the Salt Lake/Utah County border.

• Due to the nature of percent changes, several small towns (Ophir, Ballard, Francis, Wallsburg) showed high growth rates although their new-resident counts measured relatively low.

• Census estimates suggest a number of towns lost population in 2015. Every town in Carbon, Emery and Wayne counties showed contraction. In addition, Kanab and Beaver City experienced notable population declines.

• Salt Lake County remains home to five of the 10 largest cities in the state. Utah County accounts for another two in the top 10. St. George is the only city in the top-10 ranking located outside the Wasatch Front.

Thursday, April 21, 2016

Your area’s labor market information is “OnTheMap”

The Census Bureau’s online mapping tool provides a wealth of location-specific labor market information 

 By Lecia Parks Langston, Senior Economist 

“If you want to put yourself on the map, publish your own map.” Ashleigh Brilliant 

This isn’t your same old blog post about data. Instead of analyzing and sharing data, this post covers how to access an extremely useful “big data” labor market information tool. What is this tool? The U.S. Census Bureau’s OnTheMap web-based mapping and reporting application. http://onthemap.ces.census.gov/

What’s so great about OnTheMap? Typically, we report labor market information at the state and county level. Local-level data is harder to come by. Along with the ability to provide labor market profiles of small and large nonstandard areas, OnTheMap graphically demonstrates where people work and where workers live. Users can define their own geographies and obtain data and maps at the census-block level of detail. This flexibility can quickly provide information for emergency and transportation planning, site location and economic development.

Do you want to understand commuting patterns for a particular area? OnTheMap can generate maps of outflow and inflow. Do you want to know the basic characteristics of workers in your town? OnTheMap has that information. Do you want to identify the employment characteristics along a specific stretch of highway? OnTheMap can deliver that data. Do you want to discern how many workers live within a 50-mile radius of a particular site? OnTheMap delivers.

Where does this data come from? OnTheMap combines federal and state administrative data on workers and employees with Census Bureau census and survey data. Don’t worry. Using state-of-the-art methods, the Census Bureau is committed to protecting the confidentiality of business and personal information.

Where People Work 

Let’s run through a few examples of how OnTheMap outputs can help you understand your local economy. Suppose the Ephraim City Council wants to know where the residents of their town work. OnTheMap indicates roughly 40 percent of the city’s working residents are employed in Ephraim itself (zip code 84627). Not surprisingly, other high concentrations of Ephraim workers are in nearby towns. Interestingly, 28 percent of Ephraim workers commute to the Wasatch Front (Salt Lake, Utah and Davis counties) for employment.


Next, the Mayor wants to know how many workers travel into Ephraim for employment. OnTheMap suggests that roughly equal numbers are entering and exiting Ephraim for employment purposes. In-commuters are most likely to drive from Manti.


 Labor Market Characteristics 

Now, these local government officials have decided they would like to know the characteristics of those folks that work or live in Ephraim. OnTheMap can provide age-group, earnings, industry, race/ethnicity, gender and educational attainment information. For example, OnTheMap shows the following characteristics for working residents of Ephraim:

• 27 percent are 29 years or younger
• 29 percent make more than $3,333 a month
• 23 percent work in education, healthcare or social services
• 8 percent are Latino
• 18 percent have at least a Bachelor’s degree
• 46 percent are female

Getting Specific 

A company thinking of locating to Ephraim is interested in the number (and characteristics) of workers within a standard commuting distance of a particular worksite. Economic development professionals can specify a particular radius and obtain a report. Other shapes (donut and plume) are also available. In addition, users can draw their own polygons in OnTheMap. To determine how many workers may be inconvenienced by a road construction project, just draw a line along the length of the project and “buffer” the selection.


You should begin to see what a valuable informational tool OnTheMap can be for planning and economic development purposes. OnTheMap is available here.
Tuesday, January 19, 2016

Educational attainment in Central Utah

By Lecia Parks Langston, Senior Economist 


“No economy can succeed without a high-quality workforce, particularly in an age of globalization and technical change.” Ben Bernanke

• With 88 percent of its population having graduated from high school, Central Utah performs just slightly better than the nation, but not as good as the state.

• Piute County shows the second-lowest share of high school graduates in the state and is the only Central Utah county with a lower rate than the United States.

• Wayne County shows the highest levels of educational attainment in Central Utah.

• Young people are less likely to have graduated from high school than their elders.

• Central Utah still shows a significantly lower share of college graduates than both the U.S. and Utah.

• Lower educational attainment reflects the lack of employment opportunities for highly educated persons in less-populated counties. Persons who pursue a higher education must often find jobs in urban areas.

• In Utah, there is a five-point spread between women (28 percent) and men (33 percent) with at least a bachelor’s degree — the largest state-level education gap in the nation. The Central Utah education gap is scarcely smaller with women at 17 percent and men at 21 percent.

• In Central Utah, as elsewhere, the higher an individual’s educational attainment, the less likely they are to be unemployed.

• The same basic relationship consistently appears in Central Utah, Utah and the U.S. — the higher the educational attainment, the higher the earnings.

• In Central Utah both veterans and nonveterans show roughly the same percentage with a bachelor’s degree or higher.


Economic success and educational attainment certainly seem connected. Well-educated populations typically display higher overall incomes, more diversification, and wider variation in employment opportunities. Site-location firms use educational attainment as a factor in making recommendations for their clients. Plus, a well-educated workforce is often a more productive workforce. On the other hand, less-populated regions may lack the job opportunities demanded by those with more education. Understanding the education of an area’s population and labor force assists us in understanding the region’s economic environment.

This article highlights the educational attainment data for Central Utah. Figures are taken from the Census Bureau’s American Community Survey (ACS) just-released five-year average figures for 2010-2014. The five-year average is the only data set available for small counties and provides comparability across regions.

You’ll notice from the visualization that there’s a lot of data available. This article will cover the information with broad brush strokes. Those truly interested in the educational attainment of a particular region can use the visualization to dig even deeper. However, keep in mind that the survey margins of error (available from the Census Bureau) for small counties might be considerable and should be used with caution.

Thursday, March 26, 2015

County population estimates for 2014 just released

The U.S. Census Bureau has just released its 2014 population estimates for counties and metro areas. Utah’s own St. George UT metro area placed fifth nationwide with a population growth rate of 2.9 percent. On the other hand, in central Utah, contracting population proved a major theme. The following visualization provides downloadable population estimates as well as the components of population change for Utah’s counties.


• In central Utah, only Sanpete County experienced population growth in 2014.

• During 2014, Piute County showed the highest rate of population decline (2.6 percent) in Utah.

• According to the Census Bureau estimates, Millard County’s population declined by roughly 20 persons during 2014. However, since 2010, the county’s overall population has increased somewhat despite net out-migration.

• Between 2010 and 2014, Piute County’s population has decreased by more than 70 persons as out-migration continued to plague the area.

• Sanpete County may have benefited from a population spillover effect from the Wasatch Front. Its population growth record is the best in central Utah. However, even in Sanpete County, roughly 300 more residents have left the county than have moved to it since 2010.

• Sevier County has presented a checkered population performance since the decade began. In 2014, the county’s population contracted by approximately 70 people as the result of net out-migration.

• Wayne County has also lost a fairly steady stream of residents over the previous four years. Over the previous four years, the county’s population has decreased by nearly 60 individuals.

Thursday, August 28, 2014

Annual Profiles

The Workforce Research and Analysis division has updated information in the county Annual Profiles.

The information available in these Annual Profiles are separated by county and state and include:
  • quick facts
  • nonfarm employment
  • unemployment
  • major employers
  • population
  • demographics
  • income and wages
  • construction
  • gross taxable sales
  • county rankings
This data is updated on an annual basis, and dates can be found at the bottom of each tab. To print any of the visualizations, see the instructions here. For more information about this data, contact your regional economist.

Tuesday, May 27, 2014

City and Town Population Estimates now available from the U.S. Census Bureau

Recently released data from the U.S. Census Bureau indicates that the fastest growing U.S. cities during 2013 congregated in the South and the West. Two of Utah’s cities were included among the list of fastest-growing cities with populations of at least 50,000. South Jordan’s 2013 rate of population growth measured 6.1 percent while Lehi expanded by 5.5 percent.

In central Utah, most cities eked out some population expansion during 2013. Ephraim showed the highest population growth at 3.1 percent. Lynndyl (2.8 percent), Koosharem (1.6 percent). On the other hand, estimates indicate all Piute County townships lost population in 2013.

Not surprisingly, the larger cities showed the highest number of new residents. Richfield (7,600), Ephraim (6,400), Delta (3,500), Manti (3,300), Mount Pleasant (3,300) and Gunnison (3,300) all added more than 3,000 residents during the year.

The Census Bureau release is available by clicking here. Or, use the visualization to examine and download data on a county basis.

Thursday, March 27, 2014

They’re Here. . . 2013 Population Estimates are out

The U.S. Census Bureau has just released its 2013 population estimates for Utah’s counties. Not only does the data estimates package provide population figures, it includes statistics for births, deaths, natural increase (births minus deaths) and migration.

According to the estimates, counties in central Utah showed some of the slower growth rates in Utah. However, Piute County proved the only area sporting a contracting population (down 0.6 percent). Sanpete County showed the most rapid growth with a 2013 increase of 0.8 percent – half of the statewide rate of 1.6 percent. Millard and Sevier counties fell right in line with population gains of 0.7 and 0.6 percent respectively. Wayne County’s population edged up by 0.4 percent.

Monday, March 24, 2014

Got Health Insurance?

Insurance deadlines under Affordable Care Act are loom. Plus, the U.S. Census Bureau just released its Small Area Health Insurance Estimates for 2012. What better time to examine just who is lacking health insurance coverage in central Utah?
Click to Enlarge

The Census Bureau uses American Community Survey data to make estimates of health insurance coverage for every county in the United States. Both those with government-provided insurance (such as Medicaid) and private health insurance are categorized as “insured” in the data tabulations. Estimates are provided only for those 65 years and older as this age group is covered by Medicare. Age, gender, income and race/ethnicity (statewide only) breakouts are available. Remember that the margins of error for small counties may be quite high.

Wednesday, February 12, 2014

Where did they come from? Where did they go? Migration in central Utah

The U.S. Census Bureau has just released their County-to-County Migration Flows tables.  This data collected by the American Community Survey tracks the yearly movements of individuals between 2007 and 2011.

There was certainly a lot of moving going on. Roughly 6 percent of the population age one and older moved across county lines or to another country during the time period. Remember, this is survey data, and the margins of error for small counties may be quite large. Margins of error can be found in the downloadable files here.

The following data visualization allows you to extract and map migration flows by individual county. Here are a few interesting tidbits from the data.

Sanpete County (home to the main campus of Snow College) and Wayne County, which lost its largest employer during the tabulated time frame, showed the highest rate of movers (19 and 17 percent respectively). Millard (12 percent) and Sevier (13 percent) counties showed relatively moderate moving rates, while Piute County clocked in with the lowest moving rate in the state—a mere 4 percent.

In central Utah, only Sanpete County displayed a higher number of move-ins than move-outs.

Thursday, December 19, 2013

The Census Bureau release Five-Year American Community Survey Estimates

The Census Bureau release Five-Year American Community Survey Estimates The U.S. Census Bureau has just released its 2008-2012 American Community Survey estimates. For those of you living in small counties, this is your chance to delve into detailed demographic data. These estimates provide small communities with information on more than 40 topics including educational attainment, income, occupation, commuting and homeowner costs. Plus, there’s more. For the first time, five-year estimates are available at the neighborhood level for the following topics:

• Disability
• Marital History
• VA Service-Connected Disability Status and Rating
• Health Insurance Coverage
• Year of Naturalization

Five-year estimates are available for the nation, all states, counties, places, census tracts and block groups. The following visualization provides a taste of the vast store of demographic information that is available from the American Community Survey. You can access all data (except at the block group level) at American FactFinder.

Tuesday, October 1, 2013

Richfield High School replacement project starting

Voters approved a bond for $46 million in June for a slate of capital improvement projects for schools across Sevier County — the largest of which is the replacement of Richfield High School.

The plan is to replace RHS in phases at its current location. The first signs of construction of the new high school are scheduled to begin in September as new tennis courts are built. The final design is not complete, but many details have been hammered out including the decision to build two stories. Most of the current buildings on the campus are going to be removed and replaced by June of 2016 in two primary phases. The first phase, some 80,000 square feet, is scheduled to be finished by the summer of 2015. Richfield Reaper

Note: Roughly 31 percent of Sevier County’s population is under 18—comparable to the under-18 year-olds share in Utah—the youngest state in the nation.  

Thursday, July 11, 2013

Part Duex. . .Heigh Ho, Heigh Ho, It’s Off to Work We Go by City

Last week we posted a visualization depicting recently released commuter-adjusted county population estimates from the U.S. Census Bureau. (Click here to see the original post.) This visualization shows similar information for Utah’s cities with 5,000 or more population.

  • Cities experiencing the highest percentage increase in daytime population due to in-commuting include Park City (where population increases by almost half during the day), Salt Lake City, South Salt Lake, Vernal, and Lindon.
  • On the other side of the scale, Summit Park, West Point, Stansbury Park, Kearns and Hooper show the largest shrinkage in workday population.
  • In terms of sheer numbers, Salt Lake City, South Salt Lake, Ogden, Murray and St. George see the largest numeric influx in workers during the day.
  • The bedroom communities of West Jordan, Kearns, Taylorsville, Roy and Millcreek experience the greatest population shrinkage during the day. 

To access all the Census Bureau tables on commuter-adjusted population, click here.


Friday, June 28, 2013

Census Bureau releases 2012 Race and Ethnic Population estimates

The Census Bureau recently released race and ethnic group population estimates for counties.

• Not surprisingly, in all Utah counties, whites make up the largest share of the population.

• San Juan County, with its large Native American residents, appears as the only county in Utah where the “minority” population outnumbers the white population.

• Along with San Juan County, Salt Lake and Weber County also show minority population greater than 20 percent.

• Counties showing population with less than 10 percent minorities include Rich, Daggett, Juab, Emery, Sevier, Garfield, Wayne, and Kane counties.

• In all counties but San Juan and Uintah (where Native Americans make up the second largest share), the Hispanic ethnic group comprises the second largest racial/ethnic group.

Detailed race/ethnic figures are available by clicking here.


Thursday, May 23, 2013

Census Bureau Releases 2012 City and Town Population Estimates

The U.S. Census Bureau has just released 2012 subcounty population estimates for areas across the country. While Texas could claim many of the fastest growing large cities (those with population of 50,000 or more), Utah’s own South Jordan ranked as the second-fastest growing city in the United States. According to Census estimates, between 2011 and 2012, this Utah city grew by 4.9 percent.

Of all Utah’s incorporated cities and towns, South Jordan also added the largest number of new residents in 2012—almost 2,600. Saratoga Springs, West Jordan, Lehi, Midvale and St. George were also among the cities with notable population additions. On the other hand, estimates show a number of cities with declining populations—notably Ephraim, Cedar City, Gunnison, Richfield, Logan and Price.

For the most part, smaller cities and towns topped the Utah list of those with the largest percent gains. Tiny Vineyard, with a 2012 population of only 180, floated to the top of the rankings with a 31-percent annual increase. With the second largest numeric increase in population, Saratoga Springs also managed the second-highest ranking for percent growth. Farmington, Vernal and Elk Ridge also found themselves at the top of the fastest growing tabulation.

Use the interactive visualization below to see individual population estimates by city and county or click here to access the Census Bureau news release.


Wednesday, March 6, 2013

County-to-County Commuting Flows Products Released

U.S. Census Bureau  has just released American Community Survey (ACS) 2006-10 County-to-County Commuting Flows Products ACS 2006-10. Though regularly produced commuting data products address where people work and where people live, these flow products uniquely describe the residence to workplace relationship.

The following visualization will allow you to select a particular Utah county to see where resident workers work (out-commuters) and also where in-commuters live. The tables below the maps can be easily downloaded into excel by selecting the table, then placing your cursor over the export icon at the bottom of the visualization and selecting "crosstab." Full data sets can also be found at the Census website, by clicking here.