Showing posts with label Local Insights. Show all posts

Thursday, May 28, 2020

Unemployment Insurance Claims Data Shed Light on the Local Economic Impacts of the COVID-19 Pandemic in Central Utah


By Lecia Parks Langston, Senior Economist


“You have power over your mind — not outside events. Realize this, and you will find strength.” Marcus Aurelius

In the wake of the COVID-19 pandemic, businesses lost revenues and workers lost jobs. But because of the time it takes to collect and collate data, economists have been left without much information to quantify the economic impacts at the local level.

But there is one ray of data illumination. Claims for unemployment benefits are promptly available and provide information about a large cross section of the economy. This post will outline what light unemployment claims data sheds on the state of central Utah’s economy.

While not all workers are protected by unemployment insurance laws, roughly 95% of jobs are covered. This makes claims data an exceptional source of information about the economy. Not included under unemployment insurance laws are most self-employed workers, about half of agricultural employment, unpaid family workers, railroad personnel (covered separately) and many nonprofit organizations (such as churches). Also, some out-of-work employees may not have worked a sufficient work history to qualify for unemployment insurance benefits, but may file anyway. Fortunately, in this time of economic distress, the social safety nets of the unemployment insurance program, special national COVID-19 funding and social programs are working together to keep workers’ income and well-being stable.

Unemployment claimants and the unemployed; they aren’t the same


Also, keep in mind that, in addition to individuals drawing unemployment benefits, the unemployment rate includes those entering and re-entering the workforce and noncovered groups without current employment. This means the number of “unemployed” will be greater than the number of claimants. In “normal” times, only about 40% of the “unemployed” are claiming benefits. The generally reported unemployment rate also has a work-search requirement. If you haven’t made any minimal attempts to find work, you aren’t counted as “unemployed.”

Watch this Space


While this analysis won’t be updated regularly, new data will be added to the data visualization on a weekly basis allowing readers to check back for the latest information.

An Unprecedented Event


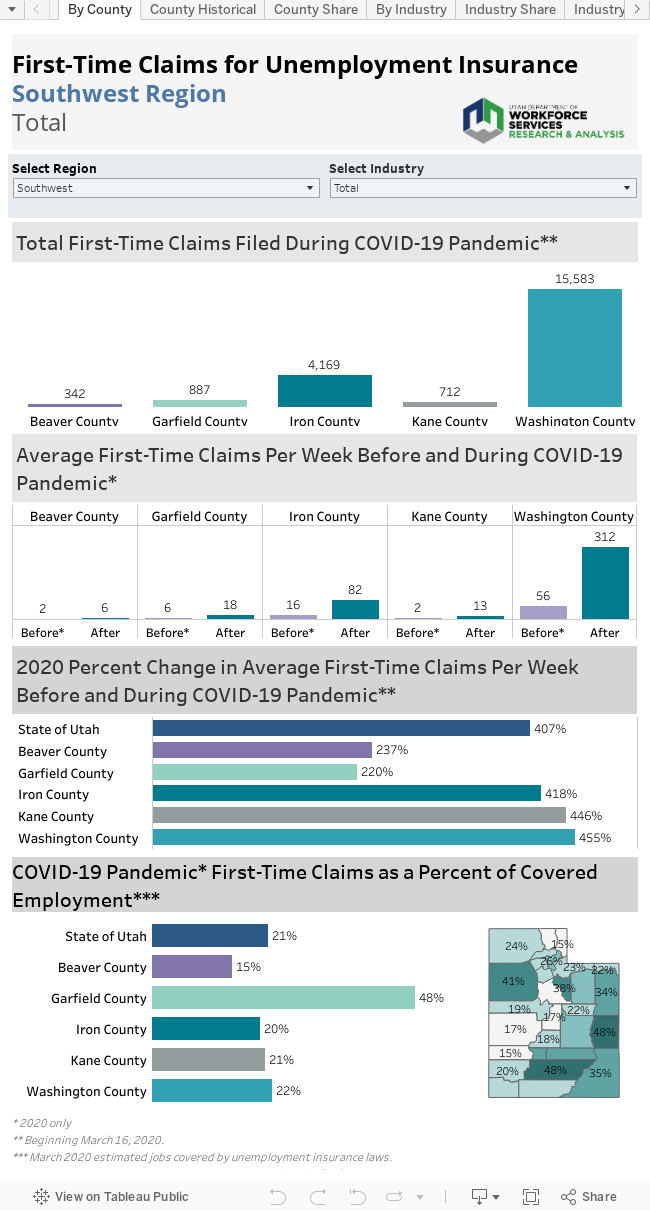
Not surprisingly, first-time claims for unemployment benefits soared in Utah and across the nation as the pandemic swept across the country. This increase is unprecedented since the creation of unemployment insurance coverage during the Great Depression. Week 12 (beginning March 16) marks the start of this unparalleled surge in claims. On a positive note, while new claims for unemployment benefits have skyrocketed in Utah, the state currently shows one of the lowest claims rates in the nation.

For most central Utah counties, initial claims peaked in the third week of the pandemic and have since tapered downward. Sevier County proved the lone exception peaking in the second week. Since mid-March, more than 1,383 new claims were filed in the region. In all of 2019, only 1,270 initial claims were filed. By week 19, claims measured considerably lower but continued to run substantially greater than in previous years, basically on par with the Great Recession.

Here’s another example of the tremendous flood of new claims. Prior to the COVID-19 pandemic, counties in central Utah averaged a total of 50 first-time claims per week. This time period in early 2020 included seasonally high-claims weeks in January. In the weeks following, an average of 173 claims were filed each week for an increase of 604%.

However, despite this historic increase in initial claims, most of central Utah fared much better than other regions in the state and nation. Even though Utah had the third lowest claims rate in the nation, its new claims increased 1,378% during the pandemic. Statewide, claims filed during the pandemic measured 10% of employment covered by unemployment insurance laws compared to only 6% in central Utah.

Who took the hardest hit?


Counties with a high-dependence on tourism felt the greatest economic and employment shocks in the slowdown. In central Utah, only Wayne County maintains a significant share of employment in tourism-related industries. It was also the hardest hit by the COVID-19 pandemic. In Wayne County, roughly 11% of individuals covered by unemployment insurance have filed a claim. Moreover, many seasonal Wayne County workers were already drawing unemployment benefits before the pandemic began. In contrast, in Millard County only 4% of covered workers filed a claim in the weeks following the start of the pandemic. Sanpete (5%) and Sevier (6%) counties also displayed relatively low rates. While Piute County’s figure measured somewhat higher at 10%, many of these claims reflect persons employed outside the county rather than within it.

Tourism and COVID-19


Especially in the early stages of the pandemic, this is a story of tourism-dependent industries. Almost 22% of post-COVID-19 initial claims filed in central Utah represented workers previously employed in accommodations and food services. In addition, the true effect of the pandemic on this industry is masked by a large number of claims classified as industry “unknown” in the early days of the claims flood. Undoubtedly, many of these claims would rightfully be classified in accommodations/food services if the appropriate information were available.

Other high-claims industries included healthcare/social assistance (reflecting the cessation of elective procedures and visits) and retail trade. Many of these high-claims industries reflect their high share of total employment in general. In addition, they often serve the public face to face or have encountered damage due to the decline in demand for travel constraints.

The High and the Low


Because of its job-to-job nature, the construction industry typically accounts for 30-50% of first-time claims in the region. However, although construction’s new claims have also increased, they have increased at a much slower-than-average rate. After the COVID-19 pandemic hit, construction contributed only about 4% of first-time claims. Ease of social-distancing and good weather have helped construction maintain its employment levels. New claims measured just 3% of covered construction employment.

Only a portion of agricultural employment is covered by unemployment insurance laws. However, as companies work to keep America fed, agribusiness in the region laid off few employees. Only 2% of central Utah’s covered agricultural workers have filed a claim during the COVID-19 pandemic.

Public administration, utilities, mining and educational services (including public and higher education), have also managed to keep a higher percentage of their workforces employed.

County by County


Millard County


  • Along with Beaver County, Millard County showed the lowest COVID-19-related claims rate in the state (4%).
  • Millard County has relatively high concentrations of employment in industries (such as covered agriculture and utilities) least affected by the pandemic.

  • Prior to the COVID-19 pandemic, Millard County averaged three unemployment claims per week compared to 26 new claims afterward, an increase of 758%.
  • Unlike most areas where accommodations/food services generated the largest number of claims, in Millard County, healthcare/social assistance topped the industry ranking followed by retail trade.
  • Construction, healthcare/social assistance and accommodations/food services showed roughly equal claims as a percentage of covered employment.
  • Millard County accounted for 12% of the Central Utah Region’s new claims prior to the pandemic, and 15% of claims during the pandemic.

Piute County


  • Less-populated Piute County maintains little employment covered under Utah’s unemployment insurance laws. In addition, a notable share of residents are employed in other counties which muddies some analysis.

  • Prior to the COVID-19 pandemic, Piute County averaged one new claim per week, compared to an average of four claims per week during the pandemic. This change represents an increase of 610%.
  • Roughly 45% of claims were filed from workers furloughed from the accommodations/food service industry. A large share of claims from the “unknown” industry category most likely originated from this industry as well.
  • Other industries contributed few new claims.
  • Piute County accounted for the same percentage (2%) of the region’s claims before and during the pandemic.

Sanpete County


  • After spiking in the early weeks of the slowdown, Sanpete County’s claims are now running roughly equivalent to the numbers experienced in the previous recession. In most Utah counties, first-time claims continue to flow in at a much higher level.
  • In the weeks before the COVID-19 pandemic, Sanpete County averaged eight initial claims per week. After the pandemic hit, claimants filed an average of 58 claims per week, marking an increase of 588%.
  • In Sanpete County, first-time claims during the pandemic period measured 5% of covered employment. That places Sanpete County near the bottom of a county-by-county ranking.
  • Unusually, healthcare/social assistance showed the highest number of new claims followed by the “usual suspect” — accommodations/food services — in the second spot.
  • Sanpete County showed a notably high share of claims emanating from an unspecified industry.
  • The relatively high percentage of mining claims compared to industry employment in Sanpete County likely reflects individuals working in other counties.

Sevier County


  • Sevier County generated the highest number of claims in the region during the pandemic.
  • Prior to the COVID-19 pandemic, Sevier County averaged 10 first-time claims per week compared with 58 claims during the pandemic. This increase of 627% ranked as the largest in the region, but far below the statewide average of 1,378%.
  • Accommodations/food services, healthcare/social assistance and retail trade originated the highest number of initial claims after the pandemic hit.
  • More than one-fourth of Sevier County’s COVID-19 initial claims were initiated in the accommodations/food services industry.
  • Sevier County’s regional share of new claims held relatively steady before and during the pandemic.

Wayne County


  • Of the five counties located in central Utah, Wayne County maintains the heaviest dependency on tourism-related employment. It also shows the highest first-time claims to covered employment ratio in the area.
  • Before the COVID-19 pandemic, an average of three initial claims were being filed in Wayne County compared to an average of 14 claims in the following weeks. The pre-to-post-COVID-19 increase registered 410%, the lowest in the region. Many seasonal workers were already drawing unemployment insurance benefits.
  • Initial claims for unemployment benefits filed during the pandemic as a percent of covered employment measured 11%, near the middle of a ranking of all Utah counties.
  • Here too, accommodations/food services was the source of the largest number of new claims, trailed far behind by retail trade.
  • More than half of all new claims during the pandemic time period originated from accommodations and food services. Roughly 20% of workers in this industry filed a new claim for unemployment after the start of the COVID-19 pandemic. Many seasonal workers were already receiving benefits.

Wednesday, October 25, 2017

Economic Hurdles in Rural Utah

by Mark Knold

Utah is a geographically large state. Based on total area, it is the 13th largest state, implying there is room to spread out. Despite all this space, Utah’s population distribution is quite concentrated. According to the U.S. Census Bureau, Utah is the nation’s 9th most urbanized state. This dichotomy has shaped a state with two economic profiles — one urban, one rural. It can be challenging for a state dominated and prospering within the urban to extend its economic bounty to the betterment of the rural.

What is rural? It depends upon one’s objective behind the question. Most define rural by a visual scan of the landscape. A lot of open land and not many people — rural. Yet economically, the view can be different. An area may look rural, but if the economic vitality of its populace is strongly integrated with a nearby urban area, then this creates a different perspective. The latter is a preference of the federal government — an entity that often makes allocation or distribution decisions based upon economic factors.


No matter how one technically defines rural, the Governor’s Office recognizes a recent dichotomy in Utah’s economic prosperity. Since the Great Recession, Utah has had compelling economic success. Yet, most of this is concentrated in Utah’s urban centers. Portions of Utah’s rural communities are not seeing matching levels of success. Utah’s Lt. Governor recently observed, “Not all of Utah’s communities are full participants in this economic success. Many counties off the Wasatch Front are experiencing challenges.”

In response to this economic disparity, the Governor’s Office has launched the 25k Jobs initiative — an effort for businesses to create 25,000 new jobs in 25 Utah counties by 2020. With this spotlight on rural Utah’s economics, let’s take a look at some of these rural challenges.

To most, jobs deliver their income and means for living sustenance. Therefore, employment, and peripheral variables associated with employment, becomes the strongest proxy for measuring the Utah economy’s health. We will look at Utah’s counties through the lens of employment, unemployment, the labor force and how the industry structure speaks to the underlying performance of these variables.

A profile of job growth becomes a starting point. Economic performance needs to be viewed with a somewhat long lens. The Governor’s 25k Jobs initiative was not born from a short-term disorder, but instead is recognition of weak longer-term fundamentals. To illustrate this perspective, one needs to backdrop the short-term mechanics against the longer-term dynamics.

The County Job Profile chart is an intersection of the short-term trend with the moderate-term. Each county is a bubble, and the bubble size reflects job counts. The chart is divided into four quadrants. The quadrants tell the story of the intersection of the short and moderate-term trends (growth or contraction) and the general health of the county’s economy.


There are two axes of measure. First, the vertical axis represents the short-term. It is the percentage of county job change between 2015 and 2016. Above the horizontal axis is growth — below is contraction.

Second, the horizontal axis measures the moderate-term. It is the percentage of job change over the past five years (2011-2016). To the right of the vertical axis is growth — to the left is contraction. Where a bubble lies is the intersection of the short and the moderate term.

To illustrate, find Beaver County on the chart. Beaver aligns with around -4.0 percent on the vertical axis, and 8.0 percent on the horizontal axis. This says that over the past five years, Beaver County’s job count has grown by 8.0 percent, but over the past year it has contracted by around 4.0 percent. This implies that Beaver County’s economy may be slipping a bit. A one-year view would imply a problem. A longer-term view places this short-term setback against a broader perspective of overall prosperity.

The quadrant of concern is the Contracting quadrant. These economies have contracted over both the most recent year and the past five years. No matter how one wants to define rural as outlined above, all of these contracting counties identify as rural.

In-county jobs alone are not the complete picture. For example, a large percentage of Morgan County’s residents commute to Weber or Davis counties for work. If jobs are not being germinated in Morgan County, the county and its population can still prosper from its ties with the urban area.

An additional way to look at the economy is through the lens of the labor force. The labor force consists of those 16-years and older who are either working or looking for work. It is based upon where people live, not where they work. A worker living in Morgan County will be represented in Morgan County on the following chart (County Labor Force Change); yet, if they work in Weber County, their job is represented in Weber County on the prior chart. Adding this perspective helps to round out a county’s profile.

The structure of the County Labor Force Change graphic is the same as the prior chart. The area of vibrancy is the upper-right quadrant where the labor force is increasing. The quadrant of labor force contraction is the lower left. A decline in the labor force occurs when people become discouraged and leave the labor force — yet stay in the county, or when people leave the county altogether. Either way, a decline in the labor force signals a fundamental negative in the economic trend.

Depending upon the variables measured, a gain in one and a decline in another can both be positive. Job growth and an unemployment decline are both positive. To associate the positive with low unemployment, the quadrant message on the Unemployment Rate chart has been transposed.

Every month an unemployment rate is calculated for Utah and each of its counties. A county’s unemployment rate can be measured against the Utah statewide average unemployment rate. In the following graphic, county rates are mathematically compared against the statewide rate (seasonally adjusted), recorded and then summed across time.

For example, if a county’s unemployment rate is 5.5 percent and the statewide rate is 4.0 percent, then that county’s difference for that month is 1.5. If a county’s rate were to be 3.5 percent against the statewide rate of 4.0 percent, then the difference is -0.5. These monthly differences are tallied and summed. A high score speaks to a consistent and persistent unemployment rate above the statewide average. In other words, these are counties with a continuous environment of high unemployment.

The horizontal axis is a measure since 2000 and the vertical axis a measure since the beginning of the Great Recession (2008). The axis intersection is not at zero to isolate the “concern area” within the upper right quadrant. The statewide average is consistently close to the Salt Lake County average, so a sizeable number of counties will have sums slightly above the statewide average; yet, this doesn’t imply an unemployment problem. But the non-zero intersection is utilized to emphasize the counties that do have an outstanding unemployment disparity.

Across these various charts, a common group of rural counties emerge in the weak quadrant. These include Carbon, Emery, Garfield, Piute and San Juan counties; with Duchesne and Uintah hanging on the edge. There is a common theme that surrounds this grouping and it centers upon low economic diversity.

An economy’s ability to be consistently positive has a strong foundation in a diverse mix of industrial employment. Think of it in terms of “not putting all your eggs in one basket.” Economic diversity is spreading jobs across many baskets. Diversity is desirable because the overall economy is not dominantly influenced by one or a handful of industries whose poor performance weighs upon the whole.

A Hachman Index is an evaluation tool measuring to what degree an economy may or may not have all its eggs in one basket. In the Hachman Index, a measure of 1.0 means your eggs are well distributed across many industries. Conversely, numbers approaching zero point to a high concentration in one or a handful of industries.


Many of the counties that score low on the previous charts are the same ones on the lowest tier of the following Hachman Index chart. This chart represents the placement of economic diversity upon employment change of the past five years. A county will be placed high or low (vertical axis) on the chart depending upon its Hachman Index score. It will align right or left (horizontal axis) depending upon its five-year employment change. Metropolitan counties have higher economic diversity than rural counties — placing them higher on the chart. They are also further to the right on the chart, showing stronger employment growth. There can be individual exceptions, but the general theme is that lack of economic diversity is a foundational impediment to economic viability. Industrial diversity, though difficult to artificially induce, is a desired remedy to counter sluggish economic performance.

Lack of diversity does not mandate a poor economy. A reproduction of this chart five years ago would have placed Uintah and Duchesne counties still low on the chart, but their five-year growth rates would have been off the chart, needing arrows to point out beyond the chosen 40 percent horizontal axis limit.

Those economies are dominated by energy production. When energy prices are high, their economies can soar. When energy falters, they often do likewise. They are striking examples of economic outcome being determined by a dominant industry.

In summary, there is a dichotomy within the Utah economy between urban and rural. The urban economies are diverse and, therefore, more economically balanced; while many rural economies are not. With some rural counties the economic distinction is not a wide divide; but in the rural counties where the divide is pronounced, the underlying theme is often a low level of economic performance.

Thursday, April 27, 2017

Census Bureau Tool Provides Labor-Force Insight for Utah


By Mark Knold and Lecia Langston

Across the United States, jobs are quantified through each state’s unemployment insurance program. Those programs provide the potential for laid-off workers to receive unemployment benefits — the goal being to bridge the gap between workers’ lost jobs and their next jobs. An eligible recipient’s weekly benefit amount is based upon their earnings from recent work. This begs the question, how does Utah’s unemployment insurance program know how much an individual recently earned while working?

That answer is supplied by all businesses that hire workers, as they must report their employees and pay as mandated by the unemployment insurance laws. Companies identify their individual workers and those workers’ monetary earnings for a calendar quarter. As businesses are identified by their industrial activity and geographic location, it is through the unemployment insurance program that aggregate employment counts by industry and location are calculated.

Yet each state’s profiling of individuals is quite minimal in the unemployment insurance program. The U.S. Census Bureau can bring more light to the overall labor force by supplementing said information with gender, age, race/ethnicity and educational attainment (imputted from American Community Survey responses) for Utah’s labor force.

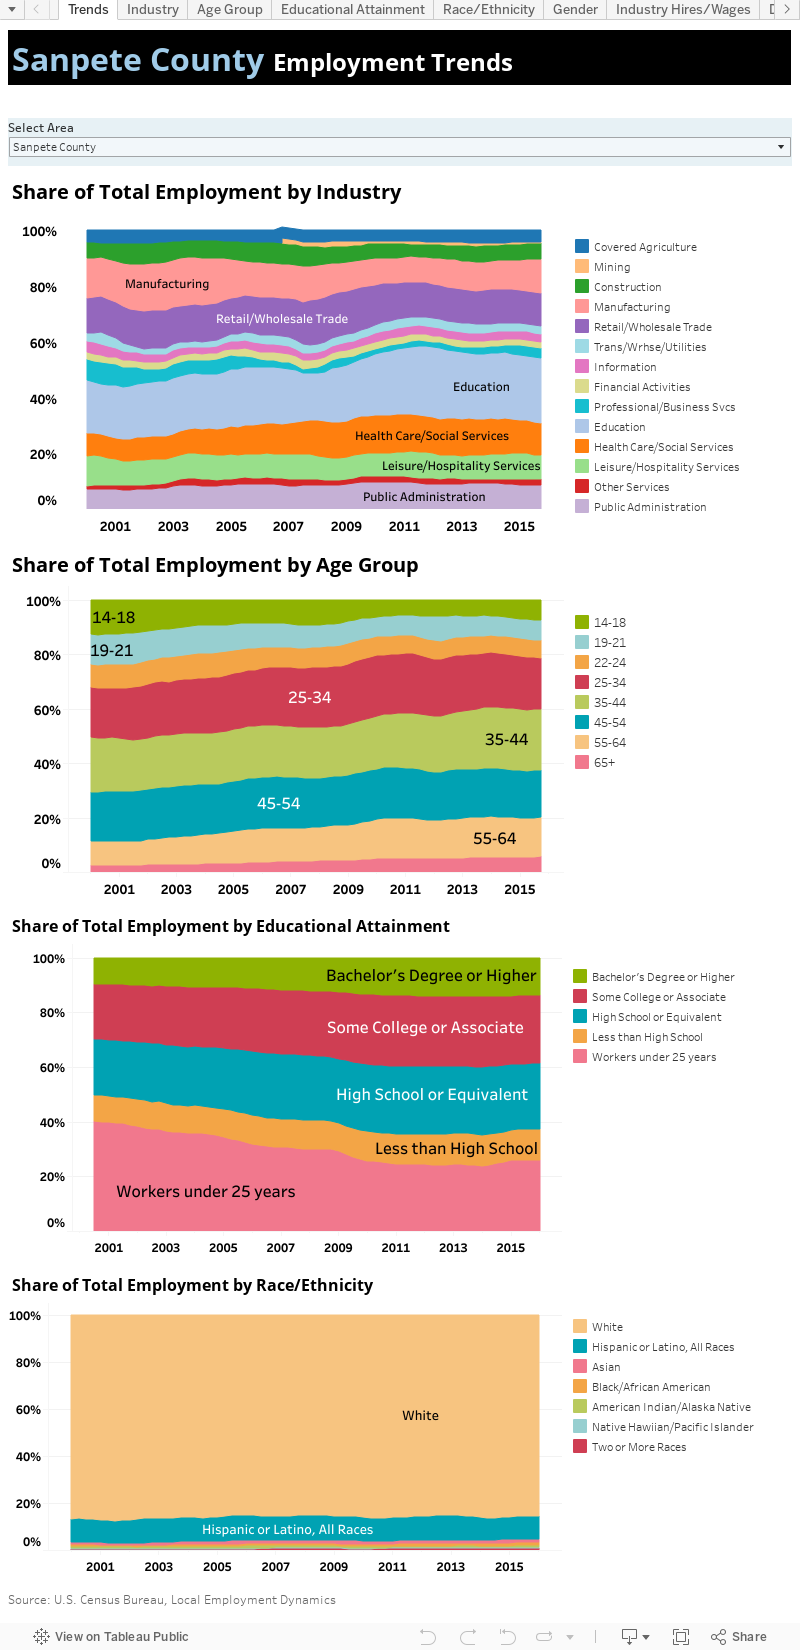
The Census Bureau packages this information through their Local Employment Dynamics program and makes available said data on its website. Here at the Department of Workforce Services, we recently downloaded and packaged Utah-specific data from said website and summarized it in the attached visualization.

Various data “tabs” are available, presenting Utah’s economy from different angles, ranging from industry shares within the economy to the age-group distributions of the labor force, to gender and race distributions. These labor variables can be viewed for the state as a whole, or by each individual county.


Monday, October 17, 2016

Show Me the Economy

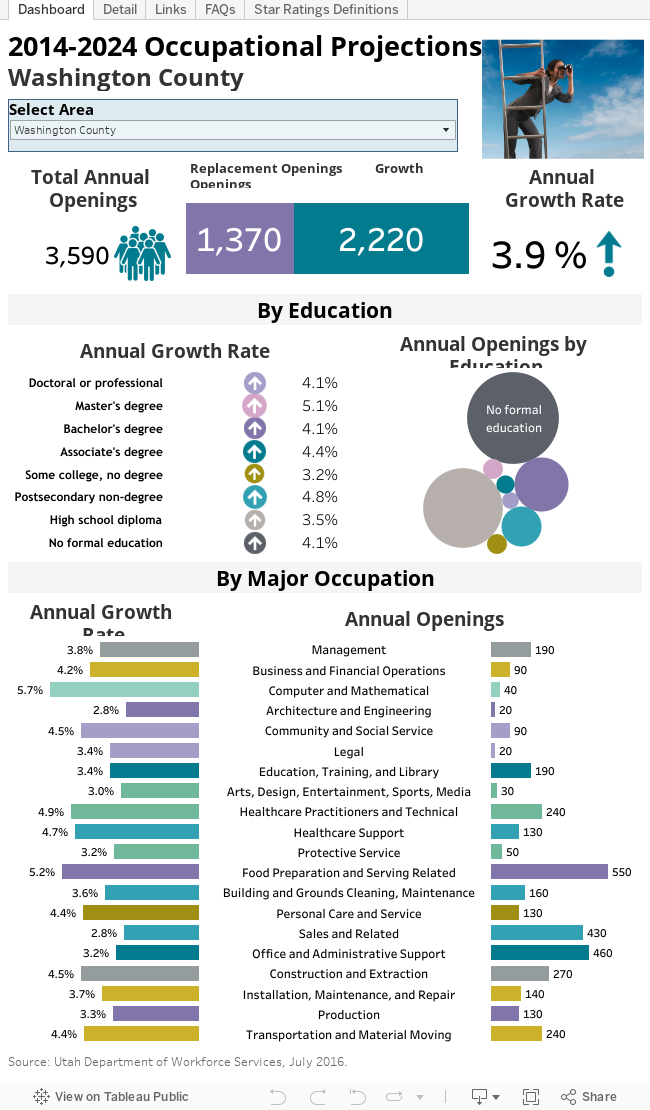
New Occupational Projections Available

Mark Knold, Supervising Economist
 
 “The government knows everything about everyone.” 

 Fortunately, that statement is not true. Yet society still looks to the government to provide answers to comprehensive and complex questions that have their foundation within individual decisions and activities. One subject frequently directed toward the government is individual-level information about the economy — particularly, what occupations are in demand, what occupations pay well and have lucrative outlooks, and ultimately, what occupation(s) should I build my career upon?

It takes the accumulation of a wide array of individual information to answer these questions. Employers provide the foundation information about the occupations they employ. Jobs are held by individuals, but employers provide the profile information about the job itself, not any particular individual.

Since society desires to profile such a broad spectrum of the economy — occupational profiles and the occupational distribution within the economy — only government is in the unique position to collect, analyze and provide answers for said desire. Yet, no government program or regulatory agency mandates any comprehensive occupational reporting from individuals or businesses. Therefore, government attempts to fill the void with an ongoing, robust and voluntary survey of employers — a survey where employers are asked to provide details about their various occupations, including descriptions, quantities, wages/salaries and location. Through this survey emerges an occupational portrait of an economy.

The U.S. Bureau of Labor Statistics (BLS) structures and funds the survey, yet the individual states conduct the survey. Under BLS administration, all states use the same methodology; therefore, occupational profiles are comparable across states.

Through this survey, analysts discover how industries are populated with various occupations. Accountant is an occupation, yet accountants can be found across many different industries. Other occupations may be more exclusive to certain industries; for example, doctors are largely found only in the healthcare industry. One of the survey’s products is that industries can be profiled with their general mix of occupations. This is called an industry’s occupational staffing pattern.

This brings us back to the original questions: what occupations are in demand, what occupations pay well and have lucrative outlooks, and ultimately, what occupation(s) should I build my career upon? The foundation is to make informed forecasts about how industries will expand/contract over the next 10 years. By applying existing occupational staffing patterns to each industry’s projected change, a trained economic analyst can then make an extrapolation about how occupations will correspondingly increase/decrease. Knowledgeable analyst judgment further refines the occupational expectations, such as knowing an occupation will grow faster than in the past, with the result being a set of occupational projections that accumulate to profile a state or regional economy.

A new set of occupational projections are done every two years to keep the information fresh even though economies do not change dramatically in short order. Because of slow change, updated occupational projects generally continue the overall message of preceding occupational projections. But economies do modify with time, and therefore, subtle changes will arise with each new set of occupational projections.

Utah’s most recent occupational projections are found here: http://www.jobs.utah.gov/wi/pubs/outlooks/state/index.html. These projections look forward to the year 2024.

The occupational profile is structured from the general to the detailed, mimicking the structure of a family tree. First, broad occupational categories are defined, such as management or healthcare occupations; then, subcategories are defined; and finally, individual occupations are defined. Individual occupations are the heart of the occupational projections. But overall patterns and characteristics do emerge when observing the broader categories.

While a Utah statewide profile leads the way, Utah’s local economies are not homogenous; therefore, nine Utah subregions are also profiled. Due to confidentiality restraints and statistical reliability, the amount of occupations available will diminish the smaller a subregion; but, occupations comprising the backbone of a regional economy will be available.


Central Region 


Lecia Parks Langston, Senior Economist 

The Central Utah projection region consists of Millard, Piute, Sanpete, Sevier and Wayne counties. Central Utah’s employment base is expected to growth at an average annual rate of 1.1 percent between 2014 and 2024. While that rate of expansion is the second-slowest in the state and falls far below the Utah average of 2.7 percent, slower expansion is not uncommon among Utah’s less-populated areas.

Over the 10-year projection period, Central Utah is expected to create 850 job openings each year. Slower-than-average growth means the need to replace workers leaving occupations will likely generate 66 percent of these openings, while new openings from growth will account for only 34 percent. Statewide, new growth is expected to produce a larger share (54 percent) of total openings.

Occupational groups with the largest current employment are expected to also generate the largest number of job openings between 2014 and 2024. Food preparation/serving and sales occupations should show the highest number of openings in Central Utah. These occupations also tend to have high replacement needs. Other occupations projected to show many openings include transportation/material moving, office/administrative support (e.g., clerical), education/training/library and management. On the other hand, the fastest growth occupational groups should be construction/extraction (e.g., mining) and production occupations.

Two occupational groups, architecture/engineering and community/social service are expected to experience slight declines in employment although they will still produce openings because of replacement needs. Other slow growing occupations include legal, protective service, office/administrative support and personal care/service occupations. Despite a low growth rate, office/administrative support occupations will still supply a large number of openings due to current employment levels and replacement needs.

Because many jobs in the Central Utah economy currently require little education and many of these positions have high replacement needs, jobs requiring a high school education or less are expected to account for 71 percent of total openings. Jobs requiring a bachelor’s degree or a high school education should show the fastest growth rates.

Individual occupations projected to produce a high volume of openings in Central Utah often pay lower-than-average wages. This is a pattern common statewide. For example, in Central Utah fast food workers, cashiers, waiters/waitresses and janitors rank among the highest opening-producing occupations. However, general/operations managers, transportation managers, heavy truck drivers, registered nurses and school teachers should also produce a large number of openings in the area.

In an attempt to help provide career guidance, the Department of Workforce Services has attached star ratings to most occupations. These ratings take into account both employment opportunities (openings and growth rate) and wages. In Central Utah, a wide variety of occupations received the five-star rating, which denotes the best employment outlook and wages in the area. The list runs the gamut from registered nurses to accountants to heavy truck drivers. For more information about star ratings detailed occupational projections, see the links in the data visualization.

Thursday, July 28, 2016

The Infrastructure Labor Market

By Mark Knold, Supervising Economist, and Lecia Parks Langston, Senior Economist

The labor force is made up of people. People vary in every conceivable way. One person is artistic while another can only draw stick people. One person might be able to disassemble and reassemble a car engine while another might not know what an alternator is. We are different. We have different aptitudes and abilities.

Parallel to this variability, jobs are different. High levels of education do make it possible to work in high-skill occupations that return high incomes. But not everyone is cut out for higher education or has the means to obtain higher education. Therefore, they might end up in “lesser” or “unimportant” jobs.

But is that accurate? Are their job options inferior and unimportant? A recent Brookings Institution report brings to light a segment of the economy that is highly important yet is dependent upon the labor force that may not be built for, have the economic means, or desire to attain a college degree or higher.


Brookings identifies a niche they call the infrastructure economy. As Brookings notes, “Infrastructure helps facilitate the exchange of information, drive production, and deliver resources, spanning multiple sectors of the economy and serving as a foundation to long-term growth.” It goes further to note that “Infrastructure jobs depend on a steady stream of talent to construct, operate, design, and govern the country’s major physical assets.”

Brookings also documents why these infrastructure jobs can appeal to the individual. “Infrastructure occupations also boast competitive wages with relatively low barriers to entry, frequently paying up to 30 percent more to workers with a high school diploma or less compared to those in all other occupations. Plumbers, truck mechanics, and power line installers are among the numerous infrastructure occupations that fall into this category, which tend to emphasize on-the-job training rather than higher levels of formal education.”

Brookings identified 95 occupations that support the infrastructure foundation. Their work was well founded and designed. This intrigued us to develop a profile of said infrastructure configuration for the Utah economy. We could not replicate the Brookings work in terms of finalizing upon infrastructure industries, but we could place our focus instead upon all infrastructure occupations.

Infrastructure occupations do not have to be found in only infrastructure industries. A helicopter pilot, an infrastructure occupation, may fly a medical helicopter for a hospital, even though said hospital is not categorized as an infrastructure industry.

What is important is that there are occupations that Brookings has identified as key occupations that help to keep the economy operating, growing, designed, and governed. And a practical appeal is that many of these jobs offer low barriers to entry while supplying competitive wages.

Across the nation, these occupations number 11.9 million, or 8.8 percent of all occupational employment. In Utah, these jobs number around 121,400, also 8.8 percent of all occupational employment. Again, the appeal of these jobs is not just that they fundamentally support so many other jobs and industries in the economy, but that these jobs don’t require a high level of education or formalized training for entry. Oftentimes these occupations emphasize only on-the-job training. Yet, these jobs pay on average 22 percent higher in Utah than other occupations that are willing to accept only a high school diploma or less.

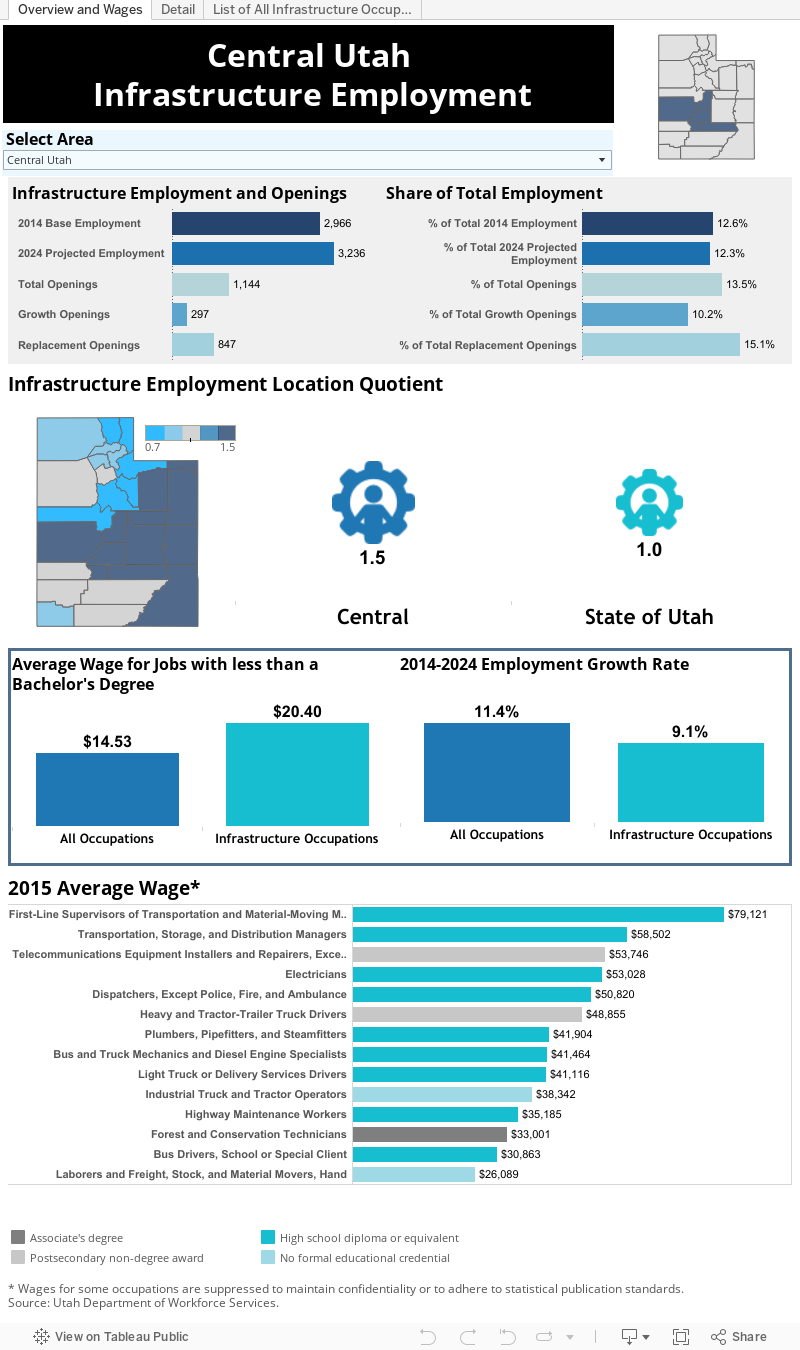
Utah does have its unique structuring across its different geographic regions, and this will include the possibility of a different profile of the infrastructure economy in each local region. The following is an infrastructure profile for the Central Utah region.

Central Utah 

Infrastructure jobs play a major role in the Central Utah economy providing better wages than other positions requiring similar education and training. 

Central Utah (Millard, Piute, Sanpete, Sevier and Wayne counties) is home to roughly 3,000 infrastructure jobs, a striking 13 percent of total employment. With this high share of employment, the area’s infrastructure location quotient is 1.4 compared to 1.0 statewide. Location quotients quantify the regional concentration of this occupational group compared to the nation. In this case, Central Utah infrastructure employment accounts for a share 40 percent greater than the national average. A large number of heavy/tractor-trailer drivers in the area are largely responsible for Central Utah’s high infrastructure location quotient.

Pay 

In Central Utah, infrastructure jobs requiring less than a Bachelor’s degree pay roughly 40 percent more than similar jobs in the overall Central Utah economy. Many of the highest-paying infrastructure occupations require just a high school education (plus on-the-job training).

Education and Training 

About 97 percent of Central Utah’s infrastructure jobs typically require less than a Bachelor’s degree. The major role played by heavy/tractor-trailer drivers in the region contributes to the large share of infrastructure jobs with a post-secondary non-degree award (40 percent). Most infrastructure jobs require little on-the-job training. More than three-fourths of the jobs are in occupations calling for on-the-job training of a month or less.

Again, a preponderance of heavy truck driver employment dominates the activities of the area’s infrastructure employment. Almost 80 percent of infrastructure employment is involved in operating activities. Construction-related activities account for the next largest share at 12 percent.

Looking Forward 

Over the next decade, infrastructure employment in Central Utah is projected to grow at a slightly slower rate (9 percent) than overall employment (11 percent). However, there is a significant need for replacements in this occupational group. While infrastructure jobs are expected to account for roughly 10 percent of openings due to growth, they should generate 15 percent of replacement openings.

Thursday, April 21, 2016

Your area’s labor market information is “OnTheMap”

The Census Bureau’s online mapping tool provides a wealth of location-specific labor market information 

 By Lecia Parks Langston, Senior Economist 

“If you want to put yourself on the map, publish your own map.” Ashleigh Brilliant 

This isn’t your same old blog post about data. Instead of analyzing and sharing data, this post covers how to access an extremely useful “big data” labor market information tool. What is this tool? The U.S. Census Bureau’s OnTheMap web-based mapping and reporting application. http://onthemap.ces.census.gov/

What’s so great about OnTheMap? Typically, we report labor market information at the state and county level. Local-level data is harder to come by. Along with the ability to provide labor market profiles of small and large nonstandard areas, OnTheMap graphically demonstrates where people work and where workers live. Users can define their own geographies and obtain data and maps at the census-block level of detail. This flexibility can quickly provide information for emergency and transportation planning, site location and economic development.

Do you want to understand commuting patterns for a particular area? OnTheMap can generate maps of outflow and inflow. Do you want to know the basic characteristics of workers in your town? OnTheMap has that information. Do you want to identify the employment characteristics along a specific stretch of highway? OnTheMap can deliver that data. Do you want to discern how many workers live within a 50-mile radius of a particular site? OnTheMap delivers.

Where does this data come from? OnTheMap combines federal and state administrative data on workers and employees with Census Bureau census and survey data. Don’t worry. Using state-of-the-art methods, the Census Bureau is committed to protecting the confidentiality of business and personal information.

Where People Work 

Let’s run through a few examples of how OnTheMap outputs can help you understand your local economy. Suppose the Ephraim City Council wants to know where the residents of their town work. OnTheMap indicates roughly 40 percent of the city’s working residents are employed in Ephraim itself (zip code 84627). Not surprisingly, other high concentrations of Ephraim workers are in nearby towns. Interestingly, 28 percent of Ephraim workers commute to the Wasatch Front (Salt Lake, Utah and Davis counties) for employment.


Next, the Mayor wants to know how many workers travel into Ephraim for employment. OnTheMap suggests that roughly equal numbers are entering and exiting Ephraim for employment purposes. In-commuters are most likely to drive from Manti.


 Labor Market Characteristics 

Now, these local government officials have decided they would like to know the characteristics of those folks that work or live in Ephraim. OnTheMap can provide age-group, earnings, industry, race/ethnicity, gender and educational attainment information. For example, OnTheMap shows the following characteristics for working residents of Ephraim:

• 27 percent are 29 years or younger
• 29 percent make more than $3,333 a month
• 23 percent work in education, healthcare or social services
• 8 percent are Latino
• 18 percent have at least a Bachelor’s degree
• 46 percent are female

Getting Specific 

A company thinking of locating to Ephraim is interested in the number (and characteristics) of workers within a standard commuting distance of a particular worksite. Economic development professionals can specify a particular radius and obtain a report. Other shapes (donut and plume) are also available. In addition, users can draw their own polygons in OnTheMap. To determine how many workers may be inconvenienced by a road construction project, just draw a line along the length of the project and “buffer” the selection.


You should begin to see what a valuable informational tool OnTheMap can be for planning and economic development purposes. OnTheMap is available here.

Tuesday, January 26, 2016

Piute County Economic Update

After a brief fling with job growth, Piute County once again found itself in the job-loss trenches in third quarter 2015. The decline represents few jobs and would be less troubling if not for the county’s relatively consistent history of job loss. Despite a sluggish job environment, the county’s unemployment rate has held relatively steady over the past year and there is no sign of unusual activity in new unemployment insurance claims. In contrast with the job market, sales exhibited a strong third quarter performance. Piute County’s economy must consistently create jobs before it can be ruled economically healthy.

  • Piute County lost nine jobs between September 2014 and September 2015 resulting in a year-to-year decline of almost 4 percent. 
  • Industry-level job increases proved virtually nonexistent. 
  • Leisure/hospitality services and retail trade experienced the largest employment declines. 
  • In December 2015, Piute County’s unemployment rate measured 6.8 percent, equal to its December 2014 figure. 
  • Piute County can absorb job losses without an increase in unemployment rates because many workers travel outside the county for employment. 
  • First-time claims for unemployment insurance followed a seasonal pattern as 2015 came to end with the largest number of claims filed in the construction industry. 
  • The county’s average monthly wage actually showed a 10-percent year-to-year gain in third quarter 2015. 
  • However, quarterly wage increases are notoriously fickle, particularly in a small county. 
  • Gross taxable sales bounced back from losses earlier in the year with a robust 15-percent third quarter increase. 
  • Strong sales in food stores, recreation and gasoline stations accounted for much of the improvement.

Tuesday, January 19, 2016

Educational attainment in Central Utah

By Lecia Parks Langston, Senior Economist 


“No economy can succeed without a high-quality workforce, particularly in an age of globalization and technical change.” Ben Bernanke

• With 88 percent of its population having graduated from high school, Central Utah performs just slightly better than the nation, but not as good as the state.

• Piute County shows the second-lowest share of high school graduates in the state and is the only Central Utah county with a lower rate than the United States.

• Wayne County shows the highest levels of educational attainment in Central Utah.

• Young people are less likely to have graduated from high school than their elders.

• Central Utah still shows a significantly lower share of college graduates than both the U.S. and Utah.

• Lower educational attainment reflects the lack of employment opportunities for highly educated persons in less-populated counties. Persons who pursue a higher education must often find jobs in urban areas.

• In Utah, there is a five-point spread between women (28 percent) and men (33 percent) with at least a bachelor’s degree — the largest state-level education gap in the nation. The Central Utah education gap is scarcely smaller with women at 17 percent and men at 21 percent.

• In Central Utah, as elsewhere, the higher an individual’s educational attainment, the less likely they are to be unemployed.

• The same basic relationship consistently appears in Central Utah, Utah and the U.S. — the higher the educational attainment, the higher the earnings.

• In Central Utah both veterans and nonveterans show roughly the same percentage with a bachelor’s degree or higher.


Economic success and educational attainment certainly seem connected. Well-educated populations typically display higher overall incomes, more diversification, and wider variation in employment opportunities. Site-location firms use educational attainment as a factor in making recommendations for their clients. Plus, a well-educated workforce is often a more productive workforce. On the other hand, less-populated regions may lack the job opportunities demanded by those with more education. Understanding the education of an area’s population and labor force assists us in understanding the region’s economic environment.

This article highlights the educational attainment data for Central Utah. Figures are taken from the Census Bureau’s American Community Survey (ACS) just-released five-year average figures for 2010-2014. The five-year average is the only data set available for small counties and provides comparability across regions.

You’ll notice from the visualization that there’s a lot of data available. This article will cover the information with broad brush strokes. Those truly interested in the educational attainment of a particular region can use the visualization to dig even deeper. However, keep in mind that the survey margins of error (available from the Census Bureau) for small counties might be considerable and should be used with caution.

Monday, November 2, 2015

In Search of an Agricultural Employment Count

What do we know about the agricultural workforce in Central Utah? 

By Lecia Parks Langston, Senior Economist

“Farming looks mighty easy when your plow is a pencil and you’re a thousand miles from the corn field.” 
Dwight D. Eisenhower
 
With all our talk of “nonfarm” jobs, you may think the Department of Workforce Services’ economists are agricultural employment bigots, always ignoring this important part of the economy. Au contraire. Trust me, we would love to share frequent agricultural employment updates if only they were available. This is particularly true since we understand the important role of agriculture in Central Utah. However, the laws that provide the administrative data we use to track nonfarm employment (through the state’s unemployment insurance system) cover only a small portion of the agricultural work occurring in Utah.


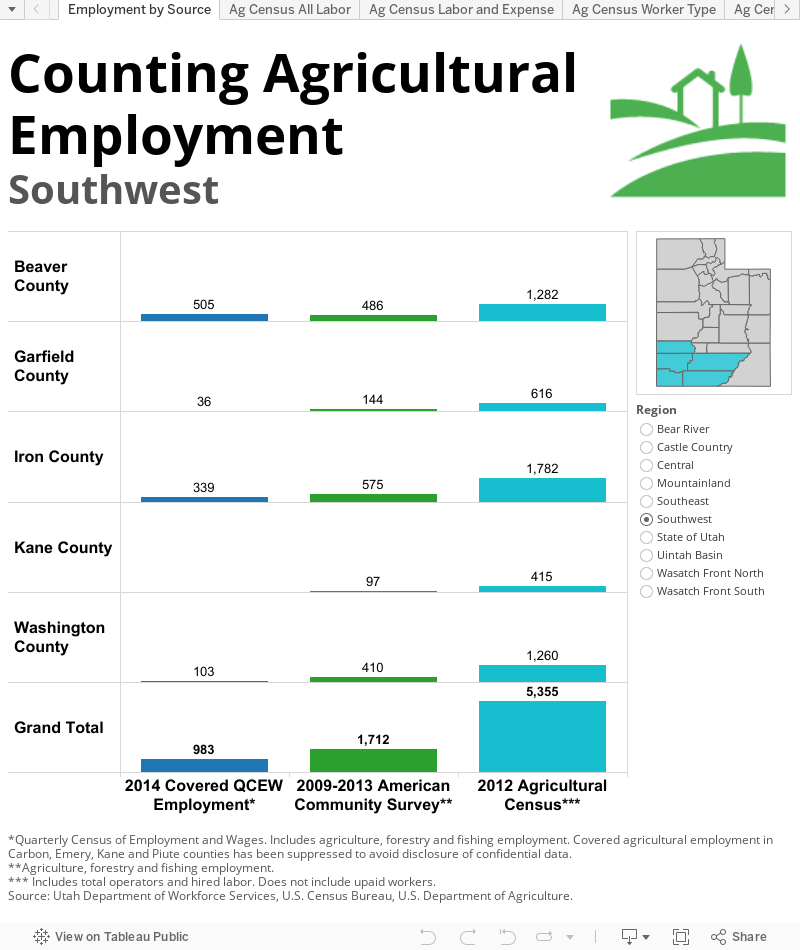
There are three primary sources of agricultural employment data; the Quarterly Census of Employment and Wages (QCEW, our usual “jobs” data), the American Community Survey (ACS) and the Census of Agriculture. As you can see from the data visualization, each yields a vastly different count of farming workers due to differences in coverage and methodology. The chart that follows this post outlines the differences. Here are some of the major variances:

• The Census of Agriculture is just that — a census. The ACS is a survey. The QCEW data is obtained from data collected as a byproduct of the administration of the unemployment insurance (UI) system, yet there are many small farming activities not subject to the UI laws.

• QCEW and the agricultural census count jobs as opposed to the ACS, which counts people in their primary industry. (One person can have several jobs.)

• QCEW omits self-employed and firms with few/intermittent employees. It is the least inclusive of the agricultural employment counts.

• The agricultural census seeks to include all those who work in agriculture, whether for a whole year or a day. It is the most inclusive of the agricultural employment counts.