Showing posts with label Region--Southwest. Show all posts

Thursday, April 21, 2016

Your area’s labor market information is “OnTheMap”

The Census Bureau’s online mapping tool provides a wealth of location-specific labor market information 

 By Lecia Parks Langston, Senior Economist 

“If you want to put yourself on the map, publish your own map.” Ashleigh Brilliant 

This isn’t your same old blog post about data. Instead of analyzing and sharing data, this post covers how to access an extremely useful “big data” labor market information tool. What is this tool? The U.S. Census Bureau’s OnTheMap web-based mapping and reporting application. http://onthemap.ces.census.gov/

What’s so great about OnTheMap? Typically, we report labor market information at the state and county level. Local-level data is harder to come by. Along with the ability to provide labor market profiles of small and large nonstandard areas, OnTheMap graphically demonstrates where people work and where workers live. Users can define their own geographies and obtain data and maps at the census-block level of detail. This flexibility can quickly provide information for emergency and transportation planning, site location and economic development.

Do you want to understand commuting patterns for a particular area? OnTheMap can generate maps of outflow and inflow. Do you want to know the basic characteristics of workers in your town? OnTheMap has that information. Do you want to identify the employment characteristics along a specific stretch of highway? OnTheMap can deliver that data. Do you want to discern how many workers live within a 50-mile radius of a particular site? OnTheMap delivers.

Where does this data come from? OnTheMap combines federal and state administrative data on workers and employees with Census Bureau census and survey data. Don’t worry. Using state-of-the-art methods, the Census Bureau is committed to protecting the confidentiality of business and personal information.

Where People Work 

Let’s run through a few examples of how OnTheMap outputs can help you understand your local economy. Suppose the Ephraim City Council wants to know where the residents of their town work. OnTheMap indicates roughly 40 percent of the city’s working residents are employed in Ephraim itself (zip code 84627). Not surprisingly, other high concentrations of Ephraim workers are in nearby towns. Interestingly, 28 percent of Ephraim workers commute to the Wasatch Front (Salt Lake, Utah and Davis counties) for employment.


Next, the Mayor wants to know how many workers travel into Ephraim for employment. OnTheMap suggests that roughly equal numbers are entering and exiting Ephraim for employment purposes. In-commuters are most likely to drive from Manti.


 Labor Market Characteristics 

Now, these local government officials have decided they would like to know the characteristics of those folks that work or live in Ephraim. OnTheMap can provide age-group, earnings, industry, race/ethnicity, gender and educational attainment information. For example, OnTheMap shows the following characteristics for working residents of Ephraim:

• 27 percent are 29 years or younger
• 29 percent make more than $3,333 a month
• 23 percent work in education, healthcare or social services
• 8 percent are Latino
• 18 percent have at least a Bachelor’s degree
• 46 percent are female

Getting Specific 

A company thinking of locating to Ephraim is interested in the number (and characteristics) of workers within a standard commuting distance of a particular worksite. Economic development professionals can specify a particular radius and obtain a report. Other shapes (donut and plume) are also available. In addition, users can draw their own polygons in OnTheMap. To determine how many workers may be inconvenienced by a road construction project, just draw a line along the length of the project and “buffer” the selection.


You should begin to see what a valuable informational tool OnTheMap can be for planning and economic development purposes. OnTheMap is available here.

Tuesday, January 26, 2016

Lady Nails opens in Ephraim

A new business, Lady Nails, has opened its doors in the Ephraim Market Mall, between Morris Casperson Accounting and Caldwell Banking Real Estate. The salon is open from 9:30 a.m. to 6:30 p.m., Monday through Saturday, closed Sundays and some holidays. Lady Nails, owned and operated by Michael and Jenny Le, is the only full-service nail salon in Sanpete County. The Le's are professionals who offer full nail services including manicures, pedicures, full set nails, refills, backfills or ‘double fills’ as well as spray-on designs. Sanpete Pyramid

Millard County Economic Update

After more than two years of expansion, Millard County took a break from job growth in the third quarter of 2015. Although jobs picked up a bit by quarter-end, public-sector losses hampered labor market growth. However, other economic indicators currently show no signs of distress. New claims for unemployment insurance are basically holding in a seasonal pattern and jobless rates remain low. Construction permitting proved robust in 2015 and sales showed a sturdy third-quarter gain. The current slowdown may prove temporary but certainly bears watching.


  • Between September 2014 and September 2015, Millard County added 20 new jobs for a tepid growth rate of 0.5 percent. 
  • Declines in state and local government employment proved the major factor in the employment growth slowdown. Utilities and manufacturing also suffered notable losses. 
  • On the positive side of the ledger, wholesale trade, private education/health/social services and leisure/hospitality services all generated significant numbers of new positions. 
  • Despite the public-sector losses, Millard County’s unemployment rate has held relatively steady for the past two years at a low rate. 
  • In December 2015, joblessness measured 3.5 percent, unchanged from a year earlier. 
  • In addition, with the exception of a blip in early autumn, first-time claims for unemployment insurance seem to be holding in a seasonal pattern. 
  • While job growth paused, the county’s average wage actually ticked up a notch. 
  • Third quarter showed a particularly healthy 3.5-percent year-to-year gain. 
  • Nonresidential permitting for industrial buildings took the lead in generating a 57-percent increase in total values for the first 11 months of 2015. 
  • The number of new home permits held steady when compared with 2014. 
  • With almost a 7-percent increase, Millard County’s gross taxable sales turned in a strong third quarter performance. 
  • Much of the rise can be traced to a prior-period adjustment. However, retail trade, accommodations and food services all showed notable gains.

Friday, May 22, 2015

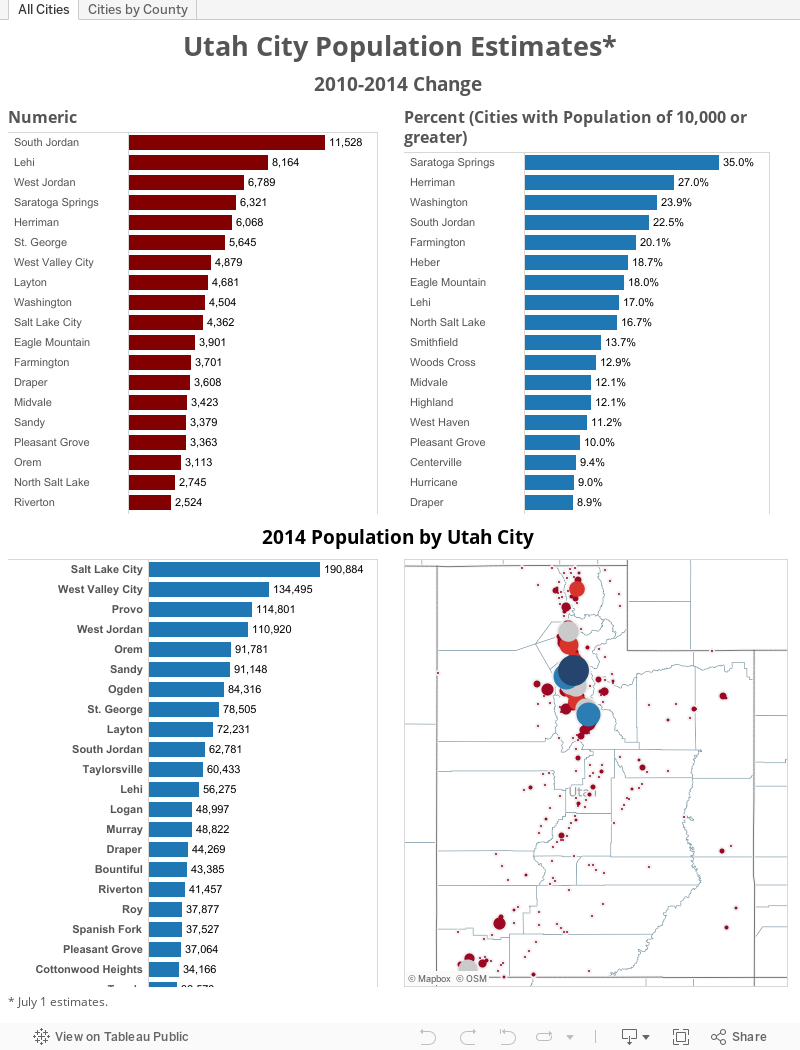
2014 City Population Estimates are now available

The U.S. Census Bureau just released its 2014 population estimates by city. You can use the following visualization to download population counts for each county.


  • Ephraim took top honors as not only the fastest growing city in central Utah, but for adding the largest number of residents (2010-2014).
  • Seven of the ten fastest growing central Utah cities are located in Sanpete County (2010-2014); the remaining three fast-growing cities/towns are situated in Millard County. The same pattern holds true for numeric growth.
  • Richfield maintained the largest population total in central Utah during 2014, followed in order by Ephraim, Delta, Manti, Mount Pleasant and Gunnison.
  • Population estimates indicate that all incorporated cities/towns in Wayne and Piute counties lost residents between 2010 and 2014.
  • In contrast, all cities and townships in Sanpete County showed expanding populations over the past four years.
  • In Millard and Sevier counties, some cities added population while others lost population.

Tuesday, April 14, 2015

Project could transform local coal market to international

The Utah Permanent Community Impact Fund Board approved some $53 million in loan funding for a project that would allow four counties — Sevier, Sanpete, Carbon and Emery — to purchase an interest in a port that is under development in Oakland, Calif. The funding was approved during a CIB meeting hosted in Salt Lake City Thursday in an 8-2 vote.

The proposal is for the CIB’s $50 million to be used to pay for a portion of the construction of a $250 million shipping port in Oakland. While CIB money would be used to fund the infrastructure, the four participating counties wouldn’t own the facility. Instead, they would own the right to use 49 percent of the port’s capacity for trans-Pacific shipping. Richfield Reaper

Tuesday, June 10, 2014

Solar energy poised to blossom in Utah desert

First Wind, which operates a 165-turbine wind farm near Milford, is now moving into the solar business. On Wednesday the company announced it has reached critical agreements with Rocky Mountain Power to purchase 20 megawatts of power from seven projects First Wind will build in Iron and Beaver counties. They will deploy 73,000 300-watt panels expected to go online in summer 2015, producing enough power for 4,000 Utah homes.

Juwi Solar, a Boulder, Colo.-based subsidiary of the German firm Juwi AG, is developing a 50-megawatt solar farm on 350 acres of private ranchlands outside Holden. The company has signed a 20-year power purchase agreement with Rocky Mountain Power.

SunEdison has the most ambitious plans for Utah, with several projects in the works in southwestern Utah. The company has secured agreements to sell 33 megawatts and is negotiating contracts for another 55. It also is eyeing four large-scale projects across sites that could generate up to 260 megawatts — about two-thirds the capacity of Salt Lake City’s Gadsby generating station. SunEdison plans on investing $500 million in Utah by 2016, generating 700 construction jobs and establishing a centralized service center in Iron County that would have 10 to 15 permanent positions. Salt Lake Tribune

Thursday, August 15, 2013

Census Bureau releases language mapper tool

Individuals Speaking Spanish in the Home
The U.S. Census Bureau recently released an interactive, online map pinpointing the wide array of languages spoken in homes across the nation, along with a detailed report on rates of English proficiency and the growing number of speakers of other languages. In concert with the release of this new tool, the Census Bureau also released a new report on Language Use in the United States, 2011. 

  • Data from the American Community Survey show that roughly 380,000 Utahns over the age of five speak a language other than English in the home—15 percent of the population.
  • Of these individuals, 36 percent spoke English less than “very well.” Slightly more than 4 percent did not speak English at all.
  • Nationally, 21 percent of the population speaks a language other than English at home. States with high shares of non-English speaking populations include California (44 percent), New Mexico (37 percent), Texas (35 percent), New Jersey (31 percent) and New York (30 percent). These states tend to have large Hispanic/Latino or immigrant populations.
  • States with the lowest shares of non-English speakers (in the home) include Kentucky (5 percent), Montana (5 percent), North Dakota (5 percent), Vermont (5 percent), Mississippi (4 percent) and West Virginia (2 percent). 

Individuals Speaking Chinese in the Home
The 2011 Language Mapper  shows where people speaking specific languages other than English live, with dots representing how many people speak each of 15 different languages. The tool uses data collected through the American Community Survey from 2007 to 2011. The mapping tool also allows mapping for those who speak English less than “very well”—a measure of English proficiency.

The screenshot showing Utah and the surrounding area shows concentrations of Spanish speakers. The “zoomed-in” map of the Salt Lake City and surroundings shows concentrations of those who speak Chinese in the home.

Thursday, July 11, 2013

Part Duex. . .Heigh Ho, Heigh Ho, It’s Off to Work We Go by City

Last week we posted a visualization depicting recently released commuter-adjusted county population estimates from the U.S. Census Bureau. (Click here to see the original post.) This visualization shows similar information for Utah’s cities with 5,000 or more population.

  • Cities experiencing the highest percentage increase in daytime population due to in-commuting include Park City (where population increases by almost half during the day), Salt Lake City, South Salt Lake, Vernal, and Lindon.
  • On the other side of the scale, Summit Park, West Point, Stansbury Park, Kearns and Hooper show the largest shrinkage in workday population.
  • In terms of sheer numbers, Salt Lake City, South Salt Lake, Ogden, Murray and St. George see the largest numeric influx in workers during the day.
  • The bedroom communities of West Jordan, Kearns, Taylorsville, Roy and Millcreek experience the greatest population shrinkage during the day. 

To access all the Census Bureau tables on commuter-adjusted population, click here.


Wednesday, July 3, 2013

Heigh Ho, Heigh Ho, It’s Off to Work We Go. . .

For most of us, commuting to work is a fact of life. For many, that commute includes crossing state, county, or city boundaries. To aid local planners and others in understanding the difference between day and night populations, the U.S. Census Bureau has just released commuter-adjusted population estimates from the American Community Survey.

Remember that the difference in workday and nonworking day populations will be affected by three factors: the number of workers who are employed within their county of residence, the number of workers who commute outside the county, and finally, the number of workers who commute to the county from homes in other areas. Conceptually, even though significant commuting can occur, out-commuting could equal in-commuting resulting in no change in the workday population.

You can use the visualization below to retrieve and examine these estimates. Later, we’ll add some city-level estimates.

  • Most Utah counties experience little difference in workday and non-workday populations. Summit, Salt Lake, and Grand counties show the largest percent change in daytime populations due to commuting. 
  • On the other hand, “bedroom” communities are more numerous. Counties with significant net out-commuting include Morgan (more than one-fifth of workers leave the county for employment), Tooele, Wasatch, Davis and Juab counties. 
  • In general, the most significant commuting occurs in and around the Wasatch Front. 
  • In terms of sheer numbers, Salt Lake County experiences the largest influx of net commuting. On a typical workday, the county’s daytime population swells by a whopping 69,000 individuals. 
  • Davis and Utah counties show the most significant net declines in population due to commuting—roughly 29,000 and 19,000 respectively. 


Census Bureau releases annual estimates of housing units

As part of its data collection and survey duties, the Census Bureau has just released its estimates of housing units for 2012. Six of Utah’s counties made it to the Bureau’s list of 100 fastest-growing counties with 5,000 or more units (2010-2012).

  • In twenty-first place nationally, Wasatch County ranked highest among the Utah counties followed by Grand, Washington, Cache, Box Elder, Utah and Uintah counties further down the list. Other than Utah County, these counties lie outside the Wasatch Front area.
  • Not surprisingly, the Wasatch Front counties—Salt Lake, Utah, Davis and Weber—maintained the highest number of housing units.
  • However, a geographic outlier, Washington County, ranked number five in the total housing unit ranking for Utah.
  •  According to the Census Bureau estimates, Piute, Sanpete, Carbon and Emery counties showed the slowest 2010-2012 expansion in housing units. Millard County actually shows a minute loss. These counties cluster geographically in the center of the state.
  • While Washington County ranked fifth in the number of total housing units, it ranked fourth for new housing stock added between 2010 and 2012.
  • On the other hand, while Weber County held fourth place for total units, it dropped to sixth for new units added. 

For more detailed data, click here.

Friday, June 28, 2013

Census Bureau releases 2012 Race and Ethnic Population estimates

The Census Bureau recently released race and ethnic group population estimates for counties.

• Not surprisingly, in all Utah counties, whites make up the largest share of the population.

• San Juan County, with its large Native American residents, appears as the only county in Utah where the “minority” population outnumbers the white population.

• Along with San Juan County, Salt Lake and Weber County also show minority population greater than 20 percent.

• Counties showing population with less than 10 percent minorities include Rich, Daggett, Juab, Emery, Sevier, Garfield, Wayne, and Kane counties.

• In all counties but San Juan and Uintah (where Native Americans make up the second largest share), the Hispanic ethnic group comprises the second largest racial/ethnic group.

Detailed race/ethnic figures are available by clicking here.


Thursday, May 23, 2013

Census Bureau Releases 2012 City and Town Population Estimates

The U.S. Census Bureau has just released 2012 subcounty population estimates for areas across the country. While Texas could claim many of the fastest growing large cities (those with population of 50,000 or more), Utah’s own South Jordan ranked as the second-fastest growing city in the United States. According to Census estimates, between 2011 and 2012, this Utah city grew by 4.9 percent.

Of all Utah’s incorporated cities and towns, South Jordan also added the largest number of new residents in 2012—almost 2,600. Saratoga Springs, West Jordan, Lehi, Midvale and St. George were also among the cities with notable population additions. On the other hand, estimates show a number of cities with declining populations—notably Ephraim, Cedar City, Gunnison, Richfield, Logan and Price.

For the most part, smaller cities and towns topped the Utah list of those with the largest percent gains. Tiny Vineyard, with a 2012 population of only 180, floated to the top of the rankings with a 31-percent annual increase. With the second largest numeric increase in population, Saratoga Springs also managed the second-highest ranking for percent growth. Farmington, Vernal and Elk Ridge also found themselves at the top of the fastest growing tabulation.

Use the interactive visualization below to see individual population estimates by city and county or click here to access the Census Bureau news release.


Friday, March 22, 2013

2012 Surge in Utah’s New Car Sales

According to data from the Utah State Tax Commission, new passenger vehicle and light truck sales increased almost 18 percent in 2012—just another sign that the Utah economy is expanding. Sales of big-ticket new cars and trucks reflect not only consumer optimism in the economy but pent-up demand that went unsatisfied during the recession.

Uintah County, already taking the top Utah rankings in population and employment growth, displayed the fastest expansion in new car sales, too—a whopping 87 percent. Obviously, not only is the current oil/gas boom spurring population growth it is generating car sales as well.

Other counties with rapidly expanding 2012 car sales included Sanpete, Weber, Iron, Washington and Salt Lake. Each exhibited annual growth rates greater than 20 percent.

However, not all counties shared in the current uptick in new car sales. Most of the counties which manifested a 2012 decline in new car and truck sales were small with low volumes. The one exception? Utah County where sales slipped by 7 percent.


Wednesday, March 20, 2013

Where did they come from? Where did they go? Part Two—County Migration Flows

The U.S. Census Bureau has just released a set of county-to-county migration flow tables based on American Community Survey data. What does that mean in plain language? On a county-by-county basis you can now track where movers to your county moved from and where those who left went.

And, instead of having to wade through a bunch of intimidating databases, the Census Bureau has created a nifty visualization to allow you to see and extract information on migration. You can access this visualization by clicking here.


Those of you who love digging through data, can click here for the full set.

Tuesday, March 19, 2013

2012 Construction Permitting Data shows Residential Building on the Upswing

Preliminary construction permitting data for Utah is currently available on the Utah Bureau of Economic and Business Research website.

Statewide, the value of issued permits rose by 5 percent—decimal dust in the volatile world of construction permitting. However, the true story in this data is the revival of residential construction permitting. The number of new dwelling unit permits issued in Utah totaled more than 11,200—a 28-percent increase from the previous year. The value of those permits increased by almost 30 percent. In addition, the value of residential additions/alterations/repair permits expanded by a healthy 33 percent.

On the other hand, new nonresidential permit values declined by 15 percent. Keep in mind that public construction projects are typically not permitted and that nonresidential building typically lags behind a surge in residential construction.

How did Utah’s various counties perform in light of the statewide gains? Let’s take a look.

  • In 2012, Uintah County, with its booming oil/gas driven employment gains, more than doubled the number of home permits it issued in 2011.
  • Other counties with rapidly expanding home permits included Davis (up 50 percent), Iron (up 45 percent), Cache (up 34 percent), Duchesne (up 33 percent) and Utah (up32 percent).
  • Most counties in the Wasatch Front, eastern and southwestern areas of the state saw home building permits increases 
  • Nevertheless, almost half of Utah’s failed to join in the home-building joy. These counties are typically rural with the central part of the state showing the largest continued permit losses. 
  • Fewer counties showed gains in new nonresidential building. Those with gains were almost entirely located along the eastern side of the state.
  • Grand (up 292 percent), Emery (up 195 percent), Summit (up 157 percent), and Wasatch (up 87 percent) showed some of the strongest nonresidential permitting gains during 2012. 

Wednesday, March 6, 2013

County-to-County Commuting Flows Products Released

U.S. Census Bureau  has just released American Community Survey (ACS) 2006-10 County-to-County Commuting Flows Products ACS 2006-10. Though regularly produced commuting data products address where people work and where people live, these flow products uniquely describe the residence to workplace relationship.

The following visualization will allow you to select a particular Utah county to see where resident workers work (out-commuters) and also where in-commuters live. The tables below the maps can be easily downloaded into excel by selecting the table, then placing your cursor over the export icon at the bottom of the visualization and selecting "crosstab." Full data sets can also be found at the Census website, by clicking here.


Thursday, January 10, 2013

How we growing? New job-growth figures available

I know. I know. Most people would rather focus on unemployment rates when talking about the state of the labor market. It’s in our human nature to focus on the negative. However, job growth (or the lack thereof) is a better indicator of labor market health than unemployment rate estimates—particularly on a county level.

Since we now have preliminary third-quarter jobs data for Utah’s counties, we’d like to share the first glimpses of the overall data here and now. Here are some important points the data reveal.

Utah, in general, is experiencing faster job-growth than the U.S. In fact, survey data for November 2012 show Utah with the second-fastest job growth rate in the nation—second only to North Dakota where booming oil-field growth is dominating expansion.

• In Utah, too, oil-gas field employment expansion in the Uintah Basin is responsible for some of Utah’s fastest growing counties. Between September 2011 and September 2012, Duchesne County’s employment has expanded by a whopping 13 percent ranking it as Utah’s job-growth leader. Uintah County ranked as the third-fastest growing county with a 4.9 percent increase.

• On the other hand, second place on the Utah job-growth tote board goes to Washington County (5.8 percent year-to-year). Washington County appears to have shaken off the recessionary shackles to generate employment expansion at its long-term average.

• Other rapidly growing counties include Sanpete, Utah, and Beaver counties—all with growth rates greater than 4 percent.

• Nevertheless, roughly one-third of Utah’s counties showed declining job totals between September 2011 and September 2012. Several of these counties have not experienced notable expansion since the recession ended.

• Many of the job-loss counties are geographically located in the east-central portion of the state.

By selecting a county in the visualization list below, you can track nonfarm job expansion contraction through the most recent business cycle.


Monday, December 17, 2012

New Income figures available

In the last few weeks, both the Census Bureau and the Bureau of Economic analysis have released new 2011 income figures for Utah and its counties. The following visualization will allow you to explore these new median household income, per capita income, and total personal income estimates. If you’d like to download the data, see the “Quick Tip” in the visualization.

And the Census holiday gifts just keep on coming. . .the Census Bureau releases five-year American Community Survey data and new data tools.

The U.S. Census Bureau recently released estimates from the American Community Survey (ACS) for the combined years from 2007 to 2011. These figures provide the only statistics down to the neighborhood level on school enrollment, jobs, housing and many other measures. You don’t need to wait every ten years for the decennial census for local-level demographics. The American Community Survey produces this information every year.

Along with the estimates, the Census Bureau is rolling out a series of new tools to make it easier to The U.S. Census Bureau today released estimates from the American Community Survey (ACS) for the combined years from 2007 to 2011, providing the only statistics down to the neighborhood level on school enrollment, jobs, housing and many other measures. These estimates are ideal for measuring trends for areas with populations of less than 20,000.

Along with the estimates, the Census Bureau is rolling out a series of new tools to make it easier to search, embed on other websites, download and share the survey estimates. The Census Bureau has updated its popular QuickFacts site with the new American Community Survey statistics, making it even easier for people to find information about a town, county or state. The Census Bureau has also launched "Easy Stats," a tool that allows users to build their own tables by selecting a desired topic and geography.

Early next year, the Census Bureau will release "Dwellr," a mobile app designed to put Census Bureau statistics directly in the hands of new users in an engaging way. Woo hoo! Data lovers rejoice.

Digging through all the data in American FactFinder can seem like a major chore if you are just looking for a few figures. Both QuickFacts and Easy Stats provide faster, easier alternatives. The charts below display data I downloaded from East Stats for my own (quite small) town of Toquerville, Utah. And, in the interest of full disclosure, I’ll reveal that my household is included in the survey data!


Thursday, October 25, 2012

New Three-Year American Community Survey Data Available

Last month, the U.S. Census Bureau released 2011 one-year American Community Survey estimates for states and large areas. Today, three-year estimates (2009-2011) are available for states and areas with a population of 20,000 or more. (I checked—the numbers are available in the American FactFinder.)

Remember that the American Community Survey replaces much of the demographic data we’re used to getting from the decennial Census. The Census Bureau calls it “the primary source of small-area estimates available on a wide range of important statistics about people and housing for every community across the country.”

Counties in Utah with new 3-year estimates include:
  • Box Elder
  • Cache
  • Carbon
  • Davis
  • Iron 
  • Salt Lake 
  • Sanpete 
  • Sevier 
  • Summit
  • Tooele 
  • Uintah 
  • Utah 
  • Wasatch 
  • Washington
  • Weber 

Data users enjoy! Click here to access the American FactFinder.