Showing posts with label Data Releases. Show all posts

Thursday, May 28, 2020

Unemployment Insurance Claims Data Shed Light on the Local Economic Impacts of the COVID-19 Pandemic in Central Utah


By Lecia Parks Langston, Senior Economist


“You have power over your mind — not outside events. Realize this, and you will find strength.” Marcus Aurelius

In the wake of the COVID-19 pandemic, businesses lost revenues and workers lost jobs. But because of the time it takes to collect and collate data, economists have been left without much information to quantify the economic impacts at the local level.

But there is one ray of data illumination. Claims for unemployment benefits are promptly available and provide information about a large cross section of the economy. This post will outline what light unemployment claims data sheds on the state of central Utah’s economy.

While not all workers are protected by unemployment insurance laws, roughly 95% of jobs are covered. This makes claims data an exceptional source of information about the economy. Not included under unemployment insurance laws are most self-employed workers, about half of agricultural employment, unpaid family workers, railroad personnel (covered separately) and many nonprofit organizations (such as churches). Also, some out-of-work employees may not have worked a sufficient work history to qualify for unemployment insurance benefits, but may file anyway. Fortunately, in this time of economic distress, the social safety nets of the unemployment insurance program, special national COVID-19 funding and social programs are working together to keep workers’ income and well-being stable.

Unemployment claimants and the unemployed; they aren’t the same


Also, keep in mind that, in addition to individuals drawing unemployment benefits, the unemployment rate includes those entering and re-entering the workforce and noncovered groups without current employment. This means the number of “unemployed” will be greater than the number of claimants. In “normal” times, only about 40% of the “unemployed” are claiming benefits. The generally reported unemployment rate also has a work-search requirement. If you haven’t made any minimal attempts to find work, you aren’t counted as “unemployed.”

Watch this Space


While this analysis won’t be updated regularly, new data will be added to the data visualization on a weekly basis allowing readers to check back for the latest information.

An Unprecedented Event


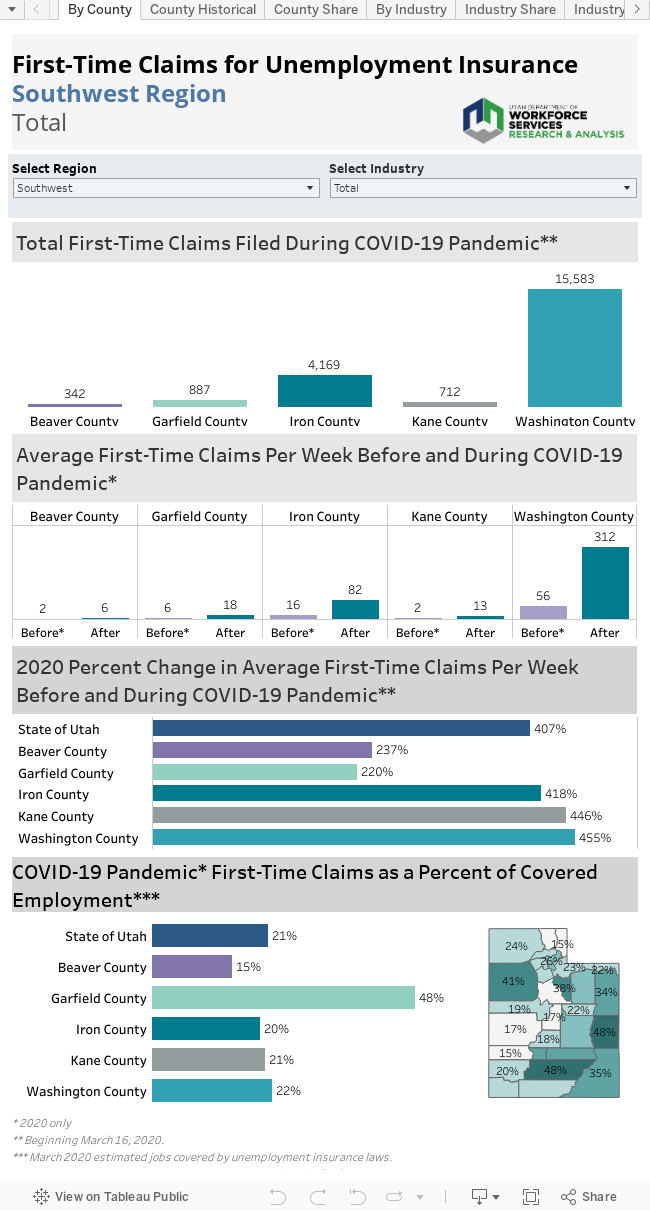
Not surprisingly, first-time claims for unemployment benefits soared in Utah and across the nation as the pandemic swept across the country. This increase is unprecedented since the creation of unemployment insurance coverage during the Great Depression. Week 12 (beginning March 16) marks the start of this unparalleled surge in claims. On a positive note, while new claims for unemployment benefits have skyrocketed in Utah, the state currently shows one of the lowest claims rates in the nation.

For most central Utah counties, initial claims peaked in the third week of the pandemic and have since tapered downward. Sevier County proved the lone exception peaking in the second week. Since mid-March, more than 1,383 new claims were filed in the region. In all of 2019, only 1,270 initial claims were filed. By week 19, claims measured considerably lower but continued to run substantially greater than in previous years, basically on par with the Great Recession.

Here’s another example of the tremendous flood of new claims. Prior to the COVID-19 pandemic, counties in central Utah averaged a total of 50 first-time claims per week. This time period in early 2020 included seasonally high-claims weeks in January. In the weeks following, an average of 173 claims were filed each week for an increase of 604%.

However, despite this historic increase in initial claims, most of central Utah fared much better than other regions in the state and nation. Even though Utah had the third lowest claims rate in the nation, its new claims increased 1,378% during the pandemic. Statewide, claims filed during the pandemic measured 10% of employment covered by unemployment insurance laws compared to only 6% in central Utah.

Who took the hardest hit?


Counties with a high-dependence on tourism felt the greatest economic and employment shocks in the slowdown. In central Utah, only Wayne County maintains a significant share of employment in tourism-related industries. It was also the hardest hit by the COVID-19 pandemic. In Wayne County, roughly 11% of individuals covered by unemployment insurance have filed a claim. Moreover, many seasonal Wayne County workers were already drawing unemployment benefits before the pandemic began. In contrast, in Millard County only 4% of covered workers filed a claim in the weeks following the start of the pandemic. Sanpete (5%) and Sevier (6%) counties also displayed relatively low rates. While Piute County’s figure measured somewhat higher at 10%, many of these claims reflect persons employed outside the county rather than within it.

Tourism and COVID-19


Especially in the early stages of the pandemic, this is a story of tourism-dependent industries. Almost 22% of post-COVID-19 initial claims filed in central Utah represented workers previously employed in accommodations and food services. In addition, the true effect of the pandemic on this industry is masked by a large number of claims classified as industry “unknown” in the early days of the claims flood. Undoubtedly, many of these claims would rightfully be classified in accommodations/food services if the appropriate information were available.

Other high-claims industries included healthcare/social assistance (reflecting the cessation of elective procedures and visits) and retail trade. Many of these high-claims industries reflect their high share of total employment in general. In addition, they often serve the public face to face or have encountered damage due to the decline in demand for travel constraints.

The High and the Low


Because of its job-to-job nature, the construction industry typically accounts for 30-50% of first-time claims in the region. However, although construction’s new claims have also increased, they have increased at a much slower-than-average rate. After the COVID-19 pandemic hit, construction contributed only about 4% of first-time claims. Ease of social-distancing and good weather have helped construction maintain its employment levels. New claims measured just 3% of covered construction employment.

Only a portion of agricultural employment is covered by unemployment insurance laws. However, as companies work to keep America fed, agribusiness in the region laid off few employees. Only 2% of central Utah’s covered agricultural workers have filed a claim during the COVID-19 pandemic.

Public administration, utilities, mining and educational services (including public and higher education), have also managed to keep a higher percentage of their workforces employed.

County by County


Millard County


  • Along with Beaver County, Millard County showed the lowest COVID-19-related claims rate in the state (4%).
  • Millard County has relatively high concentrations of employment in industries (such as covered agriculture and utilities) least affected by the pandemic.

  • Prior to the COVID-19 pandemic, Millard County averaged three unemployment claims per week compared to 26 new claims afterward, an increase of 758%.
  • Unlike most areas where accommodations/food services generated the largest number of claims, in Millard County, healthcare/social assistance topped the industry ranking followed by retail trade.
  • Construction, healthcare/social assistance and accommodations/food services showed roughly equal claims as a percentage of covered employment.
  • Millard County accounted for 12% of the Central Utah Region’s new claims prior to the pandemic, and 15% of claims during the pandemic.

Piute County


  • Less-populated Piute County maintains little employment covered under Utah’s unemployment insurance laws. In addition, a notable share of residents are employed in other counties which muddies some analysis.

  • Prior to the COVID-19 pandemic, Piute County averaged one new claim per week, compared to an average of four claims per week during the pandemic. This change represents an increase of 610%.
  • Roughly 45% of claims were filed from workers furloughed from the accommodations/food service industry. A large share of claims from the “unknown” industry category most likely originated from this industry as well.
  • Other industries contributed few new claims.
  • Piute County accounted for the same percentage (2%) of the region’s claims before and during the pandemic.

Sanpete County


  • After spiking in the early weeks of the slowdown, Sanpete County’s claims are now running roughly equivalent to the numbers experienced in the previous recession. In most Utah counties, first-time claims continue to flow in at a much higher level.
  • In the weeks before the COVID-19 pandemic, Sanpete County averaged eight initial claims per week. After the pandemic hit, claimants filed an average of 58 claims per week, marking an increase of 588%.
  • In Sanpete County, first-time claims during the pandemic period measured 5% of covered employment. That places Sanpete County near the bottom of a county-by-county ranking.
  • Unusually, healthcare/social assistance showed the highest number of new claims followed by the “usual suspect” — accommodations/food services — in the second spot.
  • Sanpete County showed a notably high share of claims emanating from an unspecified industry.
  • The relatively high percentage of mining claims compared to industry employment in Sanpete County likely reflects individuals working in other counties.

Sevier County


  • Sevier County generated the highest number of claims in the region during the pandemic.
  • Prior to the COVID-19 pandemic, Sevier County averaged 10 first-time claims per week compared with 58 claims during the pandemic. This increase of 627% ranked as the largest in the region, but far below the statewide average of 1,378%.
  • Accommodations/food services, healthcare/social assistance and retail trade originated the highest number of initial claims after the pandemic hit.
  • More than one-fourth of Sevier County’s COVID-19 initial claims were initiated in the accommodations/food services industry.
  • Sevier County’s regional share of new claims held relatively steady before and during the pandemic.

Wayne County


  • Of the five counties located in central Utah, Wayne County maintains the heaviest dependency on tourism-related employment. It also shows the highest first-time claims to covered employment ratio in the area.
  • Before the COVID-19 pandemic, an average of three initial claims were being filed in Wayne County compared to an average of 14 claims in the following weeks. The pre-to-post-COVID-19 increase registered 410%, the lowest in the region. Many seasonal workers were already drawing unemployment insurance benefits.
  • Initial claims for unemployment benefits filed during the pandemic as a percent of covered employment measured 11%, near the middle of a ranking of all Utah counties.
  • Here too, accommodations/food services was the source of the largest number of new claims, trailed far behind by retail trade.
  • More than half of all new claims during the pandemic time period originated from accommodations and food services. Roughly 20% of workers in this industry filed a new claim for unemployment after the start of the COVID-19 pandemic. Many seasonal workers were already receiving benefits.

Tuesday, May 26, 2020

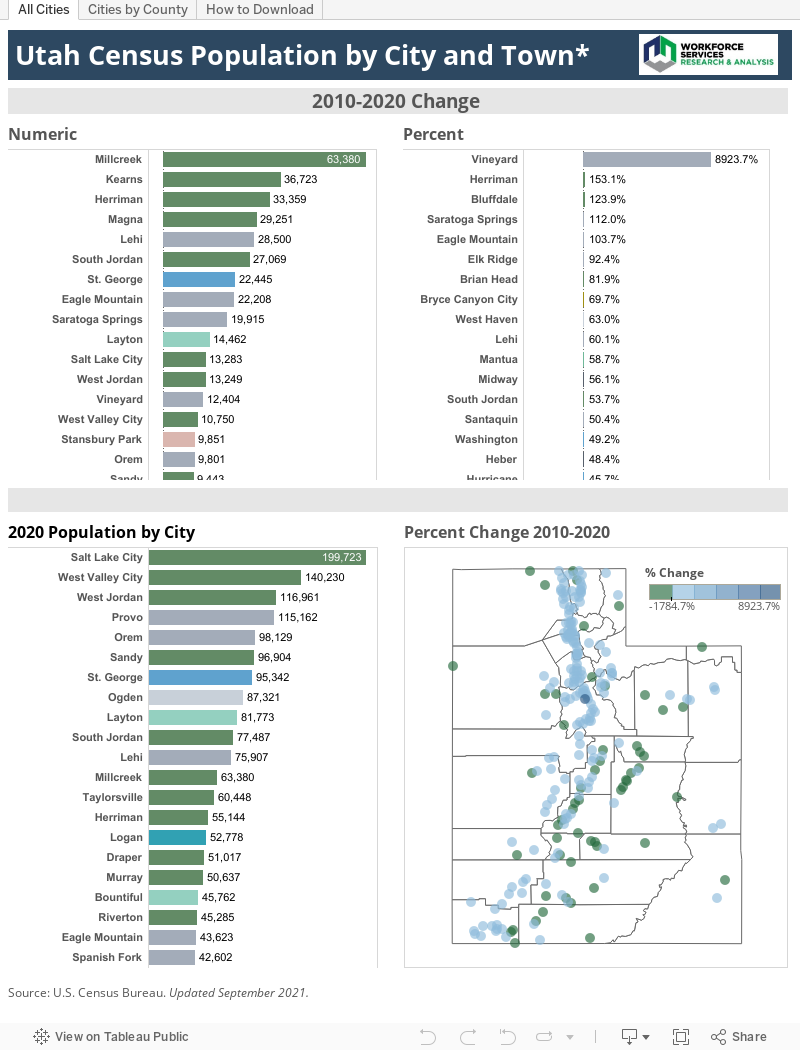
2019 City Population Estimates Now Available

Tuesday, April 7, 2020

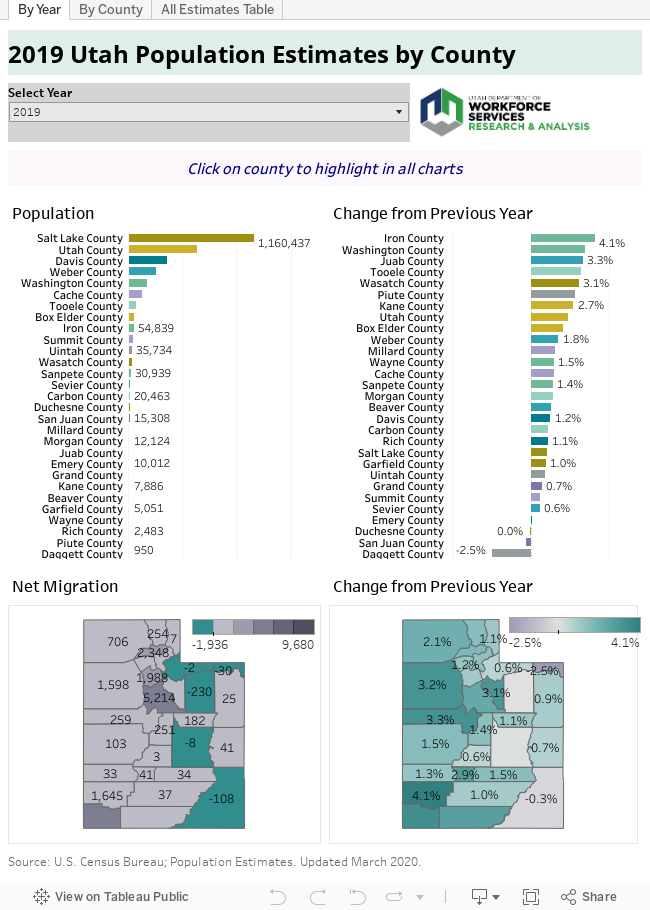
The U.S. Census Bureau Releases County Population Estimates for 2019

Next year, actual counts from the decennial census will be available

By Lecia Parks Langston, Senior Economist
“Any time you have population growth, there are business opportunities.” Roland Dorson
 
Hopefully, all Utahns are taking a break from COVID-19 concerns to respond (by phone, online or by mail) to their 2020 Census questionnaires (https://2020census.gov/). Since the Census results help determine how billions of dollars in federal funding are spent, accurate counts are important in order for Utah’s communities to get their “fair share.”
 
Because the actual counts are not yet available, the U.S. Census Bureau has just released the last set of population estimates for the decade. What do they show?


  • Iron County took the lead in population growth rates for 2019 — up by 4.1%. Following close behind was its neighbor, Washington County, with a growth rate of 3.5%.
  • Other fast-growing areas included counties at the edge of urban spread, such as Juab, Tooele and Wasatch.
  • Although Piute County saw an increase of only about 30 individuals, its small base population also resulted in a strong percentage increase (2.9%).
  • Utah County showed the highest percentage increase (2.4%) of the big-four Wasatch Front counties.
  • Estimates for both San Juan and Daggett counties suggested a decline in population, while Duchesne County’s population appeared to hold steady.
  • Utah County experienced the largest numeric gain in population — nearly 15,000 residents, followed by Salt Lake County (up about 12,000) and Washington County (up nearly 6,000).
  • Utah and Washington counties finished neck-and-neck in the race for net in-migration. Utah County’s net in-migration measured 5,200 compared to 5,100 for Washington County.
  • Several counties displayed net out-migration. Most notable on the list were Duchesne and San Juan counties. Daggett, Emery and Summit counties showed lesser out-migration estimates.
  • For its size, Utah County shows a relatively high number of births and a low number of deaths, placing its natural increase not far behind population-dense Salt Lake County.
  • Although Washington and Cache counties showed roughly equivalent numbers of births, deaths in Washington County measured much higher.
  • In 2019, Emery County experienced its first (albeit small) population growth in more than a decade.
  • Morgan County’s 2019 growth rate slipped below the state average for the first time this decade.
  • Wayne County saw its best population growth (1.5%) of the past 10 years in 2019.
  • Between 2010 and 2019, Wasatch County was the third fastest growing county in the nation. Washington County (St George, UT MSA) was the fifth fastest growing metropolitan area in the United States between 2010 and 2019. Its relatively small size contributes mathematically to a high growth rate. The Provo-Orem, UT MSA ranked ninth.
These aren’t the only estimates in town. The Kem C. Gardner Policy Institute at the University of Utah has assembled the Utah Population Committee (UPC) to reinstitute the population-estimates work previously conducted by the Utah Population Estimates Committee (UPEC). These estimates can be found here.
U.S. Census Bureau estimates use the same methodology in producing population figures for every county in the nation. Therefore, for nationwide comparisons, U.S. Census Bureau estimates may have the advantage. On the other hand, UPC population estimates have the benefit of local-analyst expertise and additional data sources.

Monday, December 17, 2018

New GDP figures will add to the local economic-analysis tool box


New GDP figures will add to the local economic-analysis tool box

By Lecia Parks Langston, Senior Economist

“We will find neither national purpose nor personal satisfaction in a mere continuation of economic progress, in an endless amassing of worldly goods. We cannot measure national spirit by the Dow Jones Average, nor national achievement by the Gross National Product.”  Robert Kennedy
As a regional economist, I’m routinely asked for gross domestic product (GDP) figures for Utah’s counties. After all, nationally, GDP is routinely tracked as an economic indicator. “Sorry,” I say, “the Bureau of Economic Analysis (BEA) doesn’t produce GDP statistics for counties (unless they are a metropolitan statistical area). But data-lovers, “the times, they are a-changin’.”
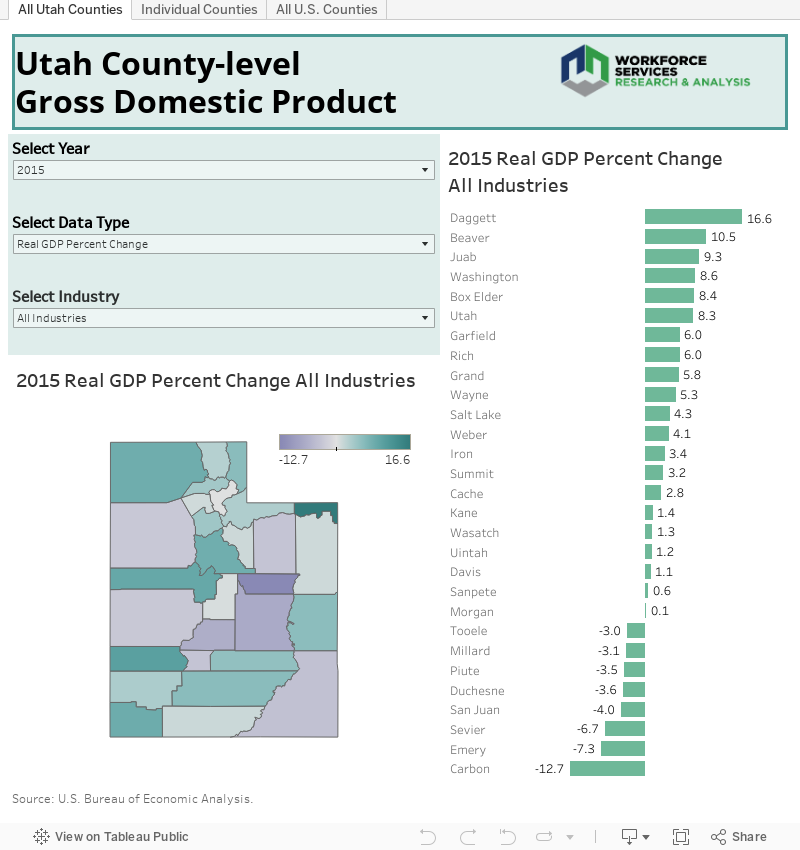
The U.S. Bureau of Economic Analysis has just released proto-type county GDP statistics for 2012 to 2015. You can explore the data in the visualization that follows.


Yes, the proto-type information is dated. However, data-users can take a first-look at the series and assist BEA by providing feedback and comments on the prototype data via e-mail at gdpbycounty@bea.gov. Official statistics are scheduled for release in December 2019.
When the official data is released, this new data will add to our ability to analyze Utah’s local economies.
What do the proto-type figures reveal? Here are a few highlights:
In 2015, eight Utah counties experienced a decline in GDP following a trend similar to 2013 and 2014.
  • Less-populated counties were most likely to experience a bout of declining GDP.
  • Daggett County, one of Utah’s smallest in both geographic size and population, showed the highest GDP growth rate in 2015 with Washington County showing the highest rate of expansion among more-populated counties.
  • It wasn’t uncommon for Utah counties to experience at least one year of GDP contraction between 2013 and 2015.
  • Not surprisingly, the vast majority of GDP is generated along the Wasatch Front.

Monday, March 5, 2018

Utah's Seasonally Adjusted Unemployment Rates

Seasonally adjusted unemployment rates for all Utah counties have been posted online here.

Each month, these rates are posted the Monday following the Unemployment Rate Update for Utah.

For more information about seasonally adjusted rates, read a DWS analysis here.

Next update scheduled for March 26th.

Friday, March 2, 2018

Utah's Employment Situation for January 2018

Utah's Employment Situation for January 2018 has been released on the web.

Find the Current Economic Situation in its entirety here.

For charts and tables, including County Employment, go to the Employment and Unemployment page.

Next update scheduled for March 23rd, 2018.


Thursday, June 1, 2017

Is Your Town Growing?

U.S. Census Bureau releases 2016 City Population Estimates


By Lecia Parks Langston, Senior Economist

“A city is more than a place in space, it is a drama in time” –Patrick Geddes

Most of Utah’s cities and towns grew in 2017, according to population estimates recently released by the U.S. Census Bureau. Lehi even ranked 11th among the nation’s fastest-growing large cities. However, not all Utah’s cities and towns experienced growth.

Use the visualization and bullet points below to explore population trends for individual townships.


• The old Geneva Steel Mill site continues to be fertile ground for population expansion. Vineyard was once again the fastest growing city in Utah. However its rate of growth has slowed dramatically since 2015. In addition, Vineyard remains relatively small in size.

• Herriman added the highest number of new residents of any city in Utah (4,550) followed by Orem, Lehi and South Jordan. All showed higher population gains than Salt Lake City — Utah’s most populous city. Herriman also showed the second-fastest rate of expansion in 2016.

• St. George was the only city outside the Wasatch Front to increase its population by more than 2,000 residents.

• The top four population-gaining cities in Utah are all located in southern Salt Lake County or northern Utah County, as the metropolitan population continued to spread outward from the large city centers. Fastest-growing larger communities also tended to be located near the Salt Lake County/Utah County border.

• Due to the nature of percent-change mathematics, several small towns (such as Monticello, Mantua, Francis, Interlaken and Hideout) showed high growth rates although their new-resident counts measured relatively low.

• The Census Bureau estimates that most of the cities and towns showing population declines were located in the Uintah Basin, Carbon County and Emery County. Declines in resource-based employment have spearheaded these population declines.

• In addition, Millard, Piute, Garfield and Wayne counties displayed a significant number of contracting townships.

• Salt Lake County remains home to five of the 10 largest cities in the state. Utah County accounts for another two in the top 10. St. George is the only city in the top-10 ranking located outside the Wasatch Front.

Friday, March 31, 2017

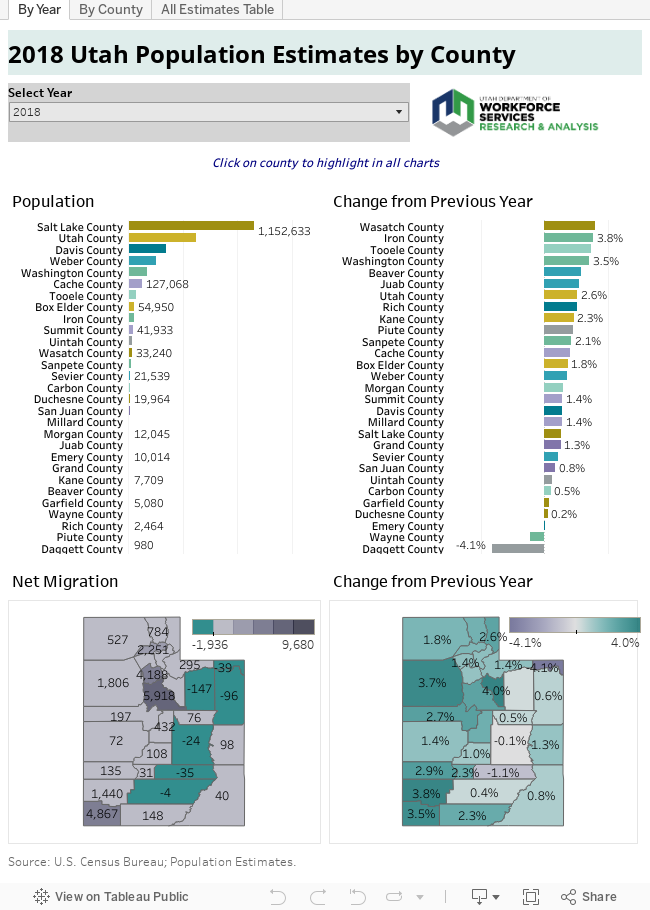
U.S. Census Bureau releases 2016 county population estimates.


By Lecia Parks Langston, Senior Economist

“In a region with a growing population, if you’re doing nothing, you’re losing ground.” Stewart Udall

The Census Bureau just released population estimates for counties and metropolitan statistical areas across the United States. Yes, it was just a few months ago that Utah made headlines as the fastest-growing state in the nation. So, it should come as no surprise that several Utah sub-areas also appeared on the fastest-growing lists.

San Juan County ranked as the fastest growing county in the nation with a 2016 growth estimate of 7.6 percent. Keep in mind that less than 17,000 people live in the county. In other words, a small numeric change in this less-populated county can result in a large percent change.

In addition, three Utah regions ranked among the top 20 fastest-growing Metropolitan Statistical Areas in the country. The St. George, Utah MSA (sixth), Provo-Orem, Utah MSA (seventh) and the Logan, Utah-Idaho MSA (20th) all attained top-20 status. See additional information on the estimates after the “jump.”


Pick a Number, Any Number


Because the Census Bureau actually counts the population only once every decade, these figures are estimates. Plus, they aren’t the only estimates in town. The Kem C. Gardner Policy Institute has recently assembled the Utah Population Committee (UPC) to reinstitute the population-estimates work previously conducted by the Utah Population Estimates Committee (UPEC). The estimates can be found here.

Census Bureau estimates use the same methodology in producing population figures for every county in the nation. Therefore, for nationwide comparisons, Census Bureau estimates may have the advantage. On the other hand, UPC population estimates have the benefit of local-analyst expertise and additional data sources.

Tuesday, October 18, 2016

Wayne County Economic Update

As is often the case for less-populated counties, what goes up rapidly can just as rapidly come down. Wayne County’s skyrocketing nonfarm job growth rate (16 percent in January) has evaporated in just six months. Whether the county can revive its employment expansion before year end is yet to be seen. Despite a tumbling job growth rate, joblessness has returned to its recent slowly declining ways. Although the unemployment rate remains high, first-time claims activity remains low. Wayne County’s mixed bag of indicators is rounded out by strong performance in both construction-permitting and sales.


  • In total, between the second quarters of 2015 and 2016, Wayne County’s nonfarm jobs increased by almost 5 percent. 
  • Unfortunately, by quarter-end, the county was experiencing slight year-over employment contraction. 
  • On an industry level, retail trade’s job gains were canceled out by leisure/hospitality services’ job losses. 
  • Other industries showed minor changes in employment totals. 
  • After a brief lull, Wayne County's jobless rate continued on its slow three-year decline and is down nearly a full percentage point from last year. 
  • The county’s August 2016 unemployment rate of 7.9 percent reflects a seasonal, tourism-driven economy. 
  • First-time claims for unemployment insurance are currently following a seasonal pattern suggesting that no unusual layoff activity has occurred so far in 2016. 
  • The leisure/hospitality services industry has generated the lion’s share of new claims so far this year. 
  • The county’s average monthly nonfarm wage took a breather from its recent expansion. 
  • Between the second quarters of 2015 and 2016, the average wage was virtually unchanged. 
  • Wayne County’s notable increase in permitted construction values is being driven by several nonresidential projects. 
  • New home building is down slightly from last year. 
  • Gross taxable sales were up almost 5 percent when the second quarters of 2015 and 2016 are compared marking four straight quarters of sales gains. 
  • Retail trade and accommodations accounted for much of the second quarter improvement.

Sevier County Economic Update

Sevier County has backed off from the healthy job growth it experienced in2015. Nonfarm job totals seem to be treading water with only marginal improvement. Although some industries have made employment strides, others have shed jobs. Slower job growth coordinates with an uptick in unemployment during spring and early summer (which has since abated). First-time claims for unemployment insurance currently show no sign of unusual economic distress. On the other hand, a dip in gross taxable sales combines with slower job growth to suggest the economy could use some revitalization.

  • After a brief dip into negative territory in May, Sevier County’s June 2016 nonfarm jobs total edged up by a little more than 1 percent (up about 110 jobs). 
  • Healthcare/social services made the largest employment contributions with help from mining, construction and the public sector. 
  • However, trade, information, leisure/hospitality services and other services all took notable job hits. 
  • After a brief uptick between March and June, Sevier County's unemployment rate has slipped back down to more normal levels. 
  • Joblessness measured 4.3 percent in August 2016, slightly higher than the statewide average, but below the national rate. 
  • In the first ten months of 2016, first-time claims for unemployment insurance followed a traditional seasonal pattern with no signs of unusual stress. 
  • So far this year, construction, retail trade and private education/healthcare/social services have generated the most claims activity. 
  • The county’s average monthly wage continued to show some improvement. 
  • Between the second quarters of 2015 and 2016 Sevier County’s average monthly wage expanded by almost 3 percent. 
  • Gross taxable sales dipped slightly (down about 1 percentage point) between the second quarters of 2015 and 2016. 
  • Despite strong sales growth at building/garden stores and food stores, a decrease in business investment expenditures and car sales put a drag on the overall sales totals.

Sanpete County Economic Update

Sanpete County’s economic indicators have aligned to paint a bright picture for the economy. Nonfarm jobs continued a two-year streak of moderate-to-strong year-over gains. While joblessness edged up slightly between March and June as workers entered and reentered the labor market, unemployment had dropped back to early 2016 levels by August. The share of out-of-work individuals remains relatively low. First-time claims for unemployment insurance also are also nominal, while construction permitting is up dramatically. Sales rounded out this strong performance with a healthy second quarter gain.

  • Between June 2015 and June 2016, Sanpete County added more than 240 nonfarm jobs for a year-to-year growth rate of 3.2 percent. 
  • Employment expansion in government, construction, manufacturing, trade/transportation/utilities and professional/business services proved sufficient to overshadow a 60-job loss in leisure/hospitality services. 
  • Other major industries experienced minor employment improvement. 
  • Following Utah’s lead, Sanpete County’s unemployment rate increased somewhat in in spring and early summer only to slip back down by summer's end. 
  • At 4.0 percent in August 2016, joblessness remains relatively low from an historical perspective. 
  • During the first 10 months of 2016, new unemployment insurance claims followed the seasonal pattern of the past several years with no sign of cyclical layoffs. 
  • Due to its project-to-project nature, construction accounted for a large share of current 2016 claims activity. 
  • Average monthly wages continued to trend upward. The county’s second quarter 2016 year-to-year gain of more than 4 percent appeared particularly encouraging. 
  • Construction permitting for the first eight months of 2016 is up substantially from the same time period in 2015. 
  • Both new residential and new nonresidential permit values contributed to the overall increase. 
  • Gross taxable sales turned in a strong second quarter 2016 gain as sales increased nearly 5 percent over second quarter 2015 figures. 
  • Sales at retail establishments registered particularly robust increases. 
  • The only decline of note was contraction in manufacturing business investment expenditures.

Piute County Economic Update

Piute County’s in-county labor market continued to struggle in the second quarter of 2016. A meager one-job gain in June was hardly sufficient to counteract job losses earlier in the quarter. Despite a rather disheartening jobs picture, unemployment slipped back down after a significant spring and early summer increase. The improvement in joblessness despite the lack of new jobs suggests workers have found employment outside the county or left the labor market all together. Moreover, the county’s jobless rate registers notably higher than the state average. While a slight uptick in sales sheds a little light on this rather gray picture, it falls far short of suggesting the county’s economy is back on track.

  • Piute County managed to stave off job loss in just one month of second quarter 2016. Moreover, the June 2016 year-over gain was merely one nonfarm job. 
  • In the last 12 months, job gains in professional/business services and leisure/hospitality services just offset job losses in government and retail trade. 
  • As in many Utah counties, Piute County joblessness bumped up a notch in spring and early summer only to edge back down, but remains relatively high. 
  • In August 2016, the unemployment rate estimate for Piute County measured 6.0 percent, more than 2 percentage points higher than the statewide average (3.7 percent). 
  • Yet, new unemployment insurance claims remain low with most claims so far this year originating in construction. 
  • The county’s average monthly wage continued to eke out gains as the year progressed. Second-quarter’s year-over gain of nearly 5 percent kept wages in 2016 trending upward. 
  • Piute County’s gross taxable sales managed modest gains. Between the second quarters o 2015 and 2016, sales increased by almost 3 percent. 
  • A notable decrease in food/beverage store sales contributed to a decline in overall retail sales. 
  • Interestingly, private motor vehicle sales generated the largest sales-dollar increase during the quarter.

Millard County Economic Update

Millard County’s labor market rallied from a lackluster performance earlier in the year with notable improvement throughout the second quarter of 2016. While the public sector provided much of the job increases, most industries added workers and the few job losses proved minor. After an unseasonal summer increase in first-time claims for unemployment insurance, the county experienced an uptick in joblessness. However, by September unemployment had retreated to its previously low level. In addition, strong nonresidential permitting has kept new building values on the high side. While sales growth proved rather lukewarm, in general, Millard County’s economic indicators provide an upbeat portrait of the area’s economy.

  • Millard County’s nonfarm jobs bounced back in the second quarter of 2016. Between June 2015 and June 2016, the county added nearly 150 new jobs for a strong 3.5 percent growth rate.
  • Much of the improvement occurred in the public sector. However, construction also managed hearty job gains. 
  •  Professional/business services, private education/healthcare/social services and leisure/hospitality services also contributed to the overall expansion with less flashy gains. 
  • Relatively minor job losses in wholesale trade and information counterbalanced only a small portion of job gains. 
  • After a slight spring and early summer uptick, Millard County's jobless rate returned to the lower rates of early 2016. 
  • At 3.4 percent, unemployment remains very low in August 2016. 
  • First-time claims for unemployment insurance took an unseasonal spike in late spring and summer but had settled back to a more normal pattern by mid-September. 
  • The construction industry contributed the largest number of new claims so far in 2016. Average wages continued to improve as the year progressed. 
  • The average wage for second quarter 2015 showed a healthy 4-percent gain over the same figure for second quarter 2016. 
  • New nonresidential permitting took the lead in the vast improvement in construction permitting values for the first eight months of 2016. 
  • Solar farm permitting as well as permits for several retail buildings contributed to the strong gain in authorized values. 
  • Gross taxable sales improved by a rather lackluster 2.2 percent between the second quarters of 2015 and 2016. 
  • A notable decline in manufacturing business investment expenditures kept a lid on overall sales. 
  • On the flip side, expenditures mining counteracted part of the manufacturing decrease. In addition,sales at retail establishments showed gains.

Tuesday, August 2, 2016

Sevier County Economic Update

After a strong end-of-year performance, Sevier County’s economy stepped back a notch in the first few months of 2016. The county continued to create new employment, but the rate of employment proved notably slower than just a quarter earlier. Nevertheless, the area hasn’t experienced employment contraction since 2013. As job growth waned, unemployment edged up. Although joblessness has risen slightly, it remains relatively low and first-time claims for unemployment insurance are running at a seasonal level. Following employment’s lead, gross taxable sales expanded but at a rather tepid rate. In general, the economy is improving, but at a lukewarm rather than scorching speed.


  • Nonfarm jobs in Sevier County grew by 1.2 percent between the March 2015 and March 2016, reflecting the addition of about 100 jobs. 
  • Healthcare/social services made the largest employment contribution followed by construction and government. 
  • While several industries contracted, the only job loss of note occurred in the tourism-driven leisure/hospitality services industry. 
  • Sevier County’s unemployment rate has increased 0.6 percentage points since the beginning of the year. 
  • Joblessness measured 4.8 percent in June 2016, below the statewide average and roughly equal to the national figure. 
  • In the first half of 2016, first-time claims for unemployment insurance followed a traditional seasonal pattern with no signs of unusual stress. 
  • So far this year, construction, retail trade and private education/healthcare/social services have generated the most claims activity. 
  • Despite decelerating job growth, Sevier County’s average monthly nonfarm wage continues to trend upward. 
  • Between the first quarters of 2015 and 2016, the average wage increased by more than 3 percent. 
  • Current construction data is not available for Sevier County. 
  • Gross taxable sales increased by a lackluster 1.4 percent between the first quarters of 2015 and 2016. 
  • General merchandise stores showed the strongest sales improvement. In addition, business investment expenditures rose nicely. 
  • On the downside, wholesale trade sales dipped noticeably.
  • Wednesday, May 18, 2016

    Mixed results in health insurance coverage in Central Utah

    The Census Bureau Releases 2014 Small Area Health Insurance Estimates 


    By Lecia Parks Langston, Senior Economist 

    “Poverty and no health insurance coverage keeps the doctor away — apples have nothing to do with it.” Beryl Dov 

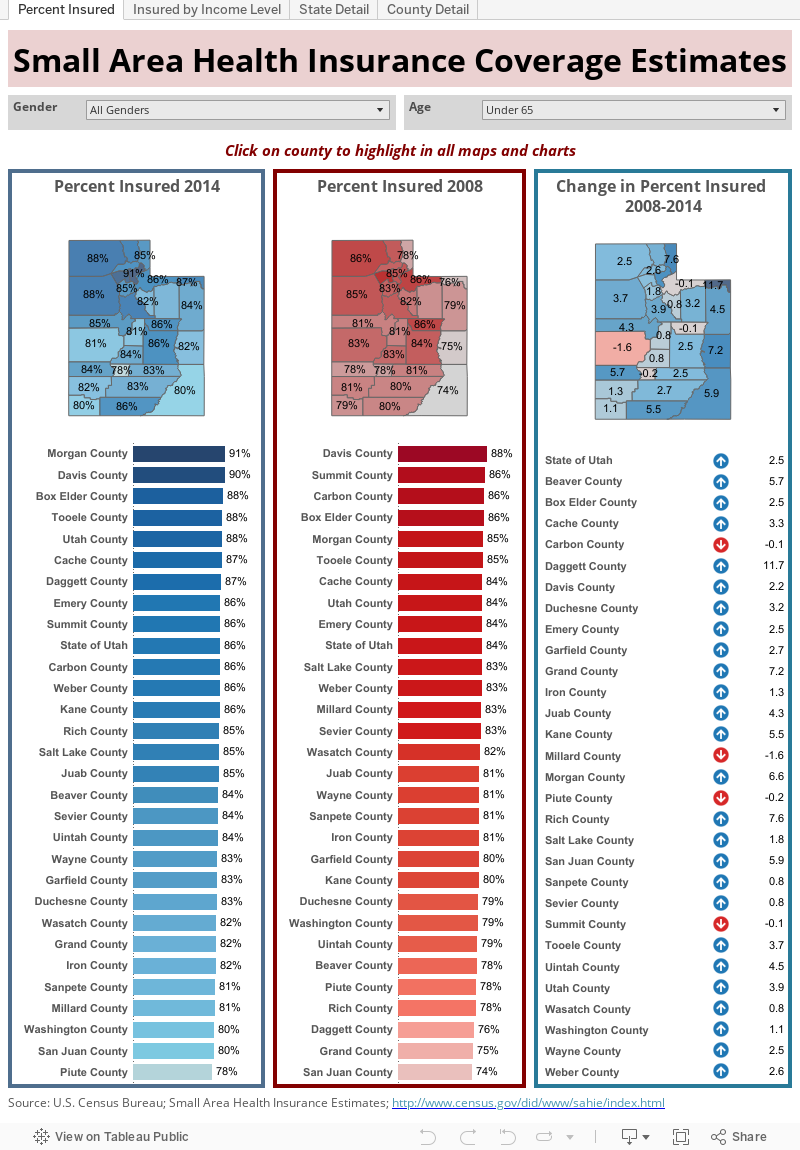
    The goals of the Affordable Care Act (ACA) include expanded health insurance coverage in the United States. Most of the Act’s health insurance expansion provisions went into effect January 1, 2014. The U.S. Census Bureau’s recently-released 2014 Small Area Health Insurance Estimates  provide an initial glimpse of the early outcomes of ACA on health insurance coverage. Keep in mind that health insurance coverage runs the gamut from employer-provided plans to personal insurance to government Medicaid and Medicare coverage. These estimates cover individuals under the age of 65, since those 65 and older are eligible for government-provided health insurance through Medicare.

    Has health insurance coverage has expanded in the Beehive State? The percentage of individuals in Utah with health insurance coverage did increase between 2009 and 2014. In 2008, 83.7 percent of the population under age 65 had some sort of health insurance according to the Census Bureau estimates (based on the American Community Survey data). By 2014, coverage had increased by an additional 2.5 percentage points to measure 86.2 percent.


    However, while most age groups showed expanding coverage, coverage for persons between 40 and 64 actually declined. In fact, coverage contracted by almost a full percentage point for those 50 to 64 years of age. On the other hand, young people under the age of 19 saw the strongest expansion in coverage.

    Gains in the percentage of insured proved particularly strong for African Americans and Latinos. Coverage for black Utahns increased by 5 percentage points while Hispanics experienced a notable 8 percentage-point gain. In contrast, white (not Hispanic) coverage increased by only 1.8 percentage points between 2008 and 2014.

    Males (up 2.7 points) were slightly more likely than females (up 2.2 points) to experience an increase in the insured share of the population. Latino males experienced the strongest expansion, the percent of insured rose 9.1 percentage points between 2008 and 2014.

    The Census Bureau provides health-insurance categories ranging from at-or-below-138 percent of poverty to at-or-below-400 percent of poverty. Those with the lowest incomes experienced the greatest increase in coverage (up 6.6 points). However, lower-income individuals are still insured at a lower rate than their higher-income peers. For example, only 73.6 percent of those at or below 138 percent of poverty are insured compared to 86.2 percent of the general population.

    Counties in the northern part of the state tend to show the highest shares of insured individuals. In 2014, Morgan, Davis, Box Elder, Tooele and Utah counties all showed insured shares of 88 percent or higher. On the opposite end of the scale, many counties in central and southern Utah showed low insured rates. In Piute, San Juan, Washington, Millard and Sanpete counties, 81 percent or less of the population under the age of 65 had health insurance.

    While most counties shared in the state’s increasing health insurance coverage, Carbon, Millard, Piute and Summit counties all showed a slight decrease in the share of insured individuals less than 65 years of age. However, the estimated declines are well within the margin of error for these counties, which suggests that coverage might not have declined at all. In general, the largest increases in health insurance coverage occurred in small counties — Daggett, Beaver, Grand, Kane, Morgan and San Juan counties.

    Wednesday, April 20, 2016

    Sanpete County Economic Update

    Sanpete County finished 2015 with continued strong employment expansion. Job growth remains moderate and fairly broad-based while unemployment continues to hover in the full-employment range. New claims for unemployment insurance are following a seasonal, noncyclical pattern. Construction also showed improvement in 2015. On the other hand, gross taxable sales did experience a slight decline, but at the root of the decrease lay volatile business-investment expenditures rather than consumer spending. Overall, the economy appears hale and hearty.

    • Between December 2014 and December 2015, Sanpete County’s nonfarm jobs grew by 3.5 percent, adding almost 270 new positions.

    • While most industries did display job increases, leisure and hospitality services sustained a notable employment hit.

    • Manufacturing created the largest number of industry-level jobs with construction, retail trade and professional/business services following close behind.

    • At 4.0 percent in March 2016, Sanpete County’s jobless rate remained low and certainly in the full-employment range.

    • Jobless rates are currently running at the lowest levels since the end of the recession.

    • During the first few months of 2016, new unemployment insurance claims followed the seasonal pattern of the past several years with no sign of cyclical layoffs.

    • Thanks to its project-to-project nature, construction accounted for a large share of current 2016 claims activity.

    • As in most Utah counties, Sanpete County’s average monthly nonfarm wage continues to slowly improve. The year-to-year fourth quarter increase proved particularly strong at 5 percent.

    • Construction permitting data suggest Sanpete County’s building environment improved dramatically during 2015.

    • The number of new home permits rose in 2015 compared to 2014, but remains low from an historical perspective.

    • Gross taxable sales did slipped by 2.3 percent between the fourth quarters of 2014 and 2015.

    • The primary reason for the dip was a year-to-year decrease in business investment expenditures in the manufacturing industry.

    • On the consumer side, retail sales were up with strong gains at building materials/garden stores and general merchandise stores.

    Sevier County Economic Update

    Sevier County ended 2015 with its best employment performance of the post-recession era. Job growth in the final quarter of the year remained moderate with most industries contributing to the improvement. The county’s unemployment rate has flattened in the last two years holding below the national average while first-time claims for unemployment insurance show no signs of business-cycle layoffs. In addition, construction permit values are up. While gross taxable sales appear to have taken a tumble, business investment expenditures accounted for most of the decline. All in all, the county’s indicators point to the healthiest economy in years.

    • Nonfarm jobs in Sevier County grew by 2.5 percent between the December 2014 and December 2015, an addition of more than 200 jobs.

    • Most industries joined in the job growth phenomenon with the largest gains occurring in healthcare/social services and leisure/hospitality services.

    • In contrast, both trade and local government lost a notable number of positions.

    • Sevier County’s jobless rate has changed little over the past two years.

    • In March 2016, the county’s unemployment rate measured 4.3 percent, nestled between the national (5.0 percent) and the statewide (3.5 percent) figures.

    • The area’s relatively stable jobless rate suggests the labor market is expanding sufficiently to absorb new labor force entrants.

    • In the first few months of the year, first-time claims for unemployment insurance followed a traditional seasonal pattern with no signs of unusual stress.

    • So far this year, construction, retail trade and professional/business services (all with temporary or seasonal components) have generated the most claims activity.

    • As in most Utah counties, Sevier County’s average monthly nonfarm wage continues to trend upward. Between the fourth quarters of 2014 and 2015 the average wage increased by nearly 5 percent.

    • Construction permitting increased nicely in 2015 showing a 14 percent uptick.

    • Both new residential and nonresidential permitting improved.

    • Gross taxable sales experienced a year-to-year loss of 15 percent in the fourth quarter of 2015.

    • The change resulted primarily from a decline in manufacturing business investment expenditures rather than in traditional sales.

    • Motor vehicle dealers, building supplies/gardening stores, general merchandise stores, and food services showed particularly strong gains.

    Wayne County Economic Update

    As 2015 came to a close, Wayne County managed to hold on to the hard-won employment expansion of previous quarters. However, significant losses in several industries suggest the county’s job situation could still stand improvement. Unemployment remains high although it is trending downward. Construction permitting values increased in 2015 with the home-building market posting its best year since the recession. Finally, gross taxable sales made strong gains. While not completely healed from the loss of its largest employer several years ago, Wayne County’s economy is certainly moving forward.

    • Overall, Wayne County’s job growth proved relatively tepid with a 2.2 percent, 19-job gain between December 2014 and December 2015.

    • Employment expansion was hampered by significant declines in leisure/hospitality services and healthcare/social services.

    • On the positive side, mining, construction and retail trade grew sufficiently to more than offset losses in other industries.

    • Joblessness continued to improve in Wayne County.

    • The county’s unemployment rate has dropped more than a full percentage point over the past year.

    • Unfortunately, at 8.1 percent, the county’s jobless rate is the fifth-highest in the state and measures far above the statewide figure of 3.5 percent.

    • First-time claims for unemployment insurance are currently following a seasonal pattern suggesting that no unusual layoff activity has occurred so far in 2016.

    • The leisure/hospitality services industry has generated the lion’s share of new claims so far this year.

    • Although the county’s average monthly wage had flattened earlier in the year, it managed a strong 8-percent wage gain between the fourth quarters of 2014 and 2015.

    • In 2015, total construction permitting values increased by a robust 26 percent.

    • Wayne County authorized more new home permits in 2015 than in any year since the recession.

    • New nonresidential permitting remained essentially flat.

    • Between the fourth quarters of 2014 and 2015, Wayne County’s gross taxable sales displayed a healthy 15-percent increase.

    • Tourism-driven accommodations and food services industries experienced especially solid improvements as did food stores, general merchandise stores and gasoline stations.

    Tuesday, January 19, 2016

    Educational attainment in Central Utah

    By Lecia Parks Langston, Senior Economist 


    “No economy can succeed without a high-quality workforce, particularly in an age of globalization and technical change.” Ben Bernanke

    • With 88 percent of its population having graduated from high school, Central Utah performs just slightly better than the nation, but not as good as the state.

    • Piute County shows the second-lowest share of high school graduates in the state and is the only Central Utah county with a lower rate than the United States.

    • Wayne County shows the highest levels of educational attainment in Central Utah.

    • Young people are less likely to have graduated from high school than their elders.

    • Central Utah still shows a significantly lower share of college graduates than both the U.S. and Utah.

    • Lower educational attainment reflects the lack of employment opportunities for highly educated persons in less-populated counties. Persons who pursue a higher education must often find jobs in urban areas.

    • In Utah, there is a five-point spread between women (28 percent) and men (33 percent) with at least a bachelor’s degree — the largest state-level education gap in the nation. The Central Utah education gap is scarcely smaller with women at 17 percent and men at 21 percent.

    • In Central Utah, as elsewhere, the higher an individual’s educational attainment, the less likely they are to be unemployed.

    • The same basic relationship consistently appears in Central Utah, Utah and the U.S. — the higher the educational attainment, the higher the earnings.

    • In Central Utah both veterans and nonveterans show roughly the same percentage with a bachelor’s degree or higher.


    Economic success and educational attainment certainly seem connected. Well-educated populations typically display higher overall incomes, more diversification, and wider variation in employment opportunities. Site-location firms use educational attainment as a factor in making recommendations for their clients. Plus, a well-educated workforce is often a more productive workforce. On the other hand, less-populated regions may lack the job opportunities demanded by those with more education. Understanding the education of an area’s population and labor force assists us in understanding the region’s economic environment.

    This article highlights the educational attainment data for Central Utah. Figures are taken from the Census Bureau’s American Community Survey (ACS) just-released five-year average figures for 2010-2014. The five-year average is the only data set available for small counties and provides comparability across regions.

    You’ll notice from the visualization that there’s a lot of data available. This article will cover the information with broad brush strokes. Those truly interested in the educational attainment of a particular region can use the visualization to dig even deeper. However, keep in mind that the survey margins of error (available from the Census Bureau) for small counties might be considerable and should be used with caution.