Showing posts with label Industries. Show all posts

Thursday, April 27, 2017

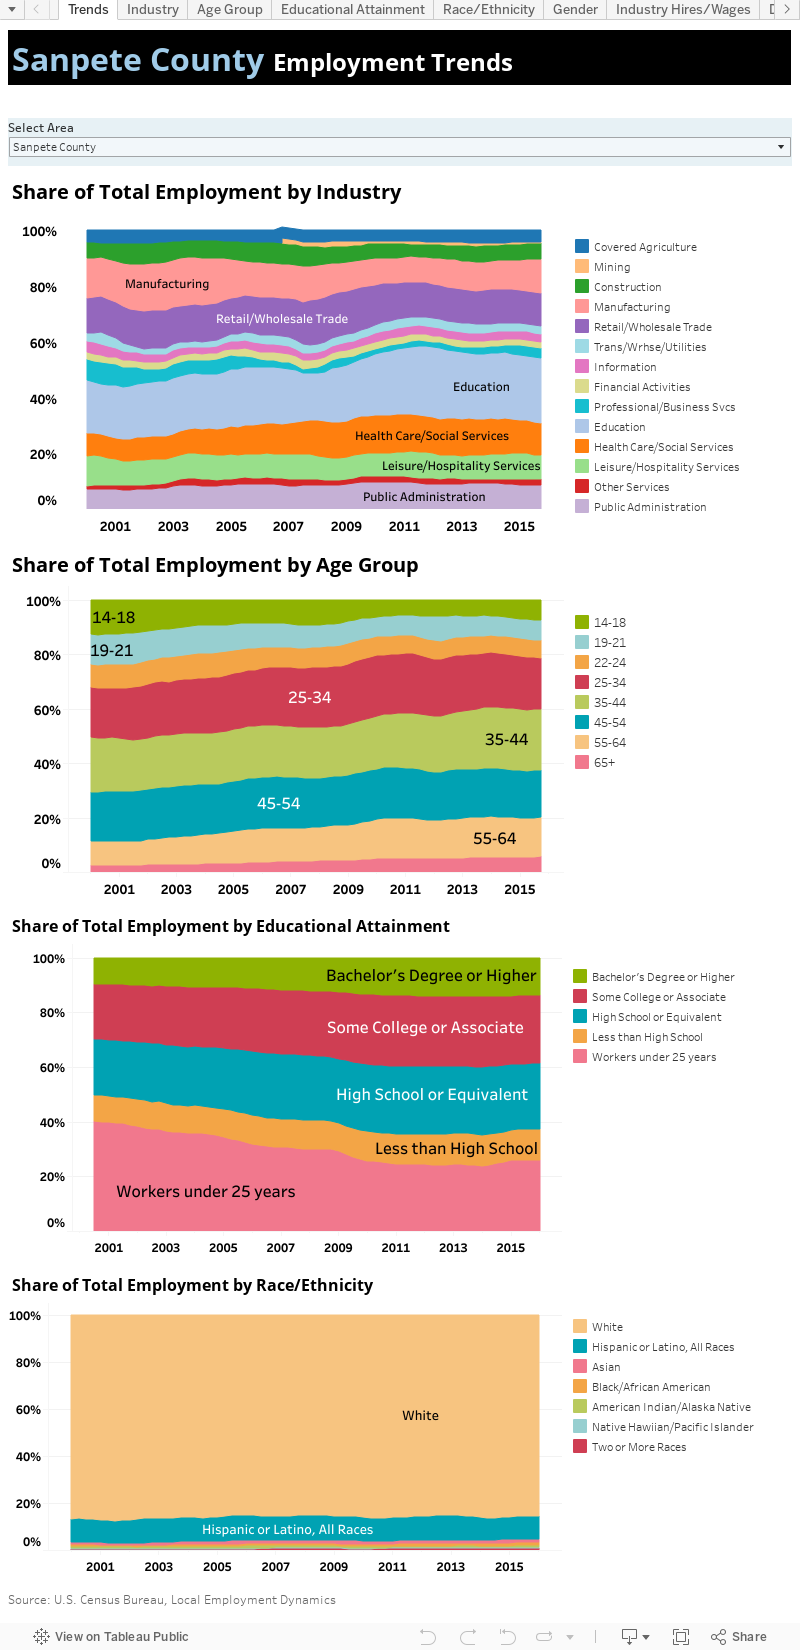
Census Bureau Tool Provides Labor-Force Insight for Utah


By Mark Knold and Lecia Langston

Across the United States, jobs are quantified through each state’s unemployment insurance program. Those programs provide the potential for laid-off workers to receive unemployment benefits — the goal being to bridge the gap between workers’ lost jobs and their next jobs. An eligible recipient’s weekly benefit amount is based upon their earnings from recent work. This begs the question, how does Utah’s unemployment insurance program know how much an individual recently earned while working?

That answer is supplied by all businesses that hire workers, as they must report their employees and pay as mandated by the unemployment insurance laws. Companies identify their individual workers and those workers’ monetary earnings for a calendar quarter. As businesses are identified by their industrial activity and geographic location, it is through the unemployment insurance program that aggregate employment counts by industry and location are calculated.

Yet each state’s profiling of individuals is quite minimal in the unemployment insurance program. The U.S. Census Bureau can bring more light to the overall labor force by supplementing said information with gender, age, race/ethnicity and educational attainment (imputted from American Community Survey responses) for Utah’s labor force.

The Census Bureau packages this information through their Local Employment Dynamics program and makes available said data on its website. Here at the Department of Workforce Services, we recently downloaded and packaged Utah-specific data from said website and summarized it in the attached visualization.

Various data “tabs” are available, presenting Utah’s economy from different angles, ranging from industry shares within the economy to the age-group distributions of the labor force, to gender and race distributions. These labor variables can be viewed for the state as a whole, or by each individual county.



Tuesday, August 2, 2016

Sanpete County Economic Update

Sanpete County rang in the new year with another quarter of strong economic growth. Nonfarm jobs showed solid gains and broad-based expansion. In contrast, joblessness has edged up in recent months. Strong employment expansion coupled with a dearth of unseasonal unemployment insurance claims activity suggests the rise is the result of workers entering and re-entering the labor market. Gross taxable sales expanded nicely falling in line with employment growth. Despite the recent uptick in unemployment, most indicators illustrate a healthy Sanpete County economy.


  • Between March 2015 and March 2016, Sanpete County added more than 280 new nonfarm jobs for a year-over growth rate of nearly 4 percent. 
  • Manufacturing produced the largest number of new jobs with healthcare/social services, retail trade and professional/business services contributing notable numbers of new positions. 
  • The only significant job loss occurred in leisure/hospitality services. Following Utah’s lead, Sanpete County’s unemployment rate has increased in recent months. 
  • However, at 4.4 percent in June 2016, joblessness remains relatively low from an historical perspective. 
  • During the first half of 2016, new unemployment insurance claims followed the seasonal pattern of the past several years with no sign of cyclical layoffs. 
  • Thanks to its project-to-project nature, construction accounted for a large share of current 2016 claims activity. Sanpete County’s average monthly nonfarm wage continues to slowly improve. 
  • However, the year-to-year increase for first quarter 2016 proved lower than usual – less than 1 percent. 
  • Current construction data is not available for Sanpete County. Gross taxable sales showed a strong 8.5 percent increase between the first quarters of 2015 and 2016. 
  • Prior-period adjustments and business investment expenditures accounted for much of the addition although food/beverage stores, general merchandise stores and private motor vehicle sales all made solid showings.
  • Wednesday, April 20, 2016

    Wayne County Economic Update

    As 2015 came to a close, Wayne County managed to hold on to the hard-won employment expansion of previous quarters. However, significant losses in several industries suggest the county’s job situation could still stand improvement. Unemployment remains high although it is trending downward. Construction permitting values increased in 2015 with the home-building market posting its best year since the recession. Finally, gross taxable sales made strong gains. While not completely healed from the loss of its largest employer several years ago, Wayne County’s economy is certainly moving forward.

    • Overall, Wayne County’s job growth proved relatively tepid with a 2.2 percent, 19-job gain between December 2014 and December 2015.

    • Employment expansion was hampered by significant declines in leisure/hospitality services and healthcare/social services.

    • On the positive side, mining, construction and retail trade grew sufficiently to more than offset losses in other industries.

    • Joblessness continued to improve in Wayne County.

    • The county’s unemployment rate has dropped more than a full percentage point over the past year.

    • Unfortunately, at 8.1 percent, the county’s jobless rate is the fifth-highest in the state and measures far above the statewide figure of 3.5 percent.

    • First-time claims for unemployment insurance are currently following a seasonal pattern suggesting that no unusual layoff activity has occurred so far in 2016.

    • The leisure/hospitality services industry has generated the lion’s share of new claims so far this year.

    • Although the county’s average monthly wage had flattened earlier in the year, it managed a strong 8-percent wage gain between the fourth quarters of 2014 and 2015.

    • In 2015, total construction permitting values increased by a robust 26 percent.

    • Wayne County authorized more new home permits in 2015 than in any year since the recession.

    • New nonresidential permitting remained essentially flat.

    • Between the fourth quarters of 2014 and 2015, Wayne County’s gross taxable sales displayed a healthy 15-percent increase.

    • Tourism-driven accommodations and food services industries experienced especially solid improvements as did food stores, general merchandise stores and gasoline stations.

    Tuesday, April 28, 2015

    Wayne County Economic Update

    Wayne County slipped back to its job-losing ways as 2014 came to an end. The county’s labor market has struggled since it lost its largest employer in 2011. Mitigating the loss somewhat, the current declines proved relatively minor. Nevertheless, downward movement in Wayne County’s unemployment rate has stalled and the rate has even ticked up in recent months. In addition, sales dropped substantially in the final quarter of the year. An improvement in construction permitting provided the most positive economic news. Overall, the county’s current economic indicators are limping along awaiting further improvement.

    • Wayne County lost 13 nonfarm jobs between December 2013 and December 2014 for a slight decline of 1.5 percent. 
    • A spurt in construction industry employment basically offset losses in the county’s leisure and hospitality services. 
    • Wayne County’s unemployment rate stood at 9.0 percent in March 2015, the highest level in Utah. 
    • Although joblessness has edged upward in recent months, the rate remains slightly below the year-ago figure of 9.4 percent. 
    • In the first few months of 2015, first-time claims for unemployment insurance followed a seasonal pattern. 
    • Most new claims originated in the construction and leisure/hospitality industries. 
    • Between the fourth quarters of 2013 and 2014, Wayne County’s gross taxable sales dipped by 12 percent. 
    • A drop in wholesale trade coupled with a prior-quarter adjustment accounted for much of the decline in sales. 
    • Retail trade, food services and accommodations all exhibited gains. 
    • In comparison to the previous year, construction permit values rose 11 percent. 
    • Both new residential and new nonresidential values increased nicely. 
    • Over the previous four years, Wayne County’s population has decreased by nearly 60 individuals due to net out-migration.

    Sevier County Economic Update

    While Sevier County’s employment gains may seem rather humdrum, the gradual gains have persisted for the entire year of 2014. That’s a welcome change from the very scarce job increases of 2013. Employment expansion has spurred joblessness to creep ever lower. Moreover, sales improved nicely and construction permitting is up from 2013. While the county’s economy isn’t ablaze with activity, slow-and-steady improvements may win the long-term race. However, the county’s job gains must spread to most industries before the labor market is considered entirely fit.

    • Year-over job growth in Sevier County measured 71 positions and almost 1 percent in December 2014. 
    • Retail trade, mining and professional/business services created most of the new employment. 
    • On the dark side, both construction and transportation took notable job hits. 
    • Employment gains proved ample enough to keep Sevier County’s unemployment trending downward. 
    • In March 2015, the county’s jobless rate measured only 4.1 percent; a sign the economy is approaching full employment. 
    • First-time claims for unemployment insurance for the first few months of 2015 remained low with construction and professional/business services (which includes “temp” agencies) generating the most new claims. 
    • Gross taxable sales shot up 27 percent between the fourth quarters of 2013 and 2014. 
    • Extremely large business-investment expenditures can be credited for much of the increase. 
    • Retail trade made healthy gains over the past year. 
    • Fourth quarter 2014 new car and truck sales increased 3 percent compared to sales a year earlier. 
    • Overall, construction permitting values rose 15 percent in 2014. 
    • The majority of the increase in construction permit values can be traced to a large nonresidential addition, alteration and repair project. 
    • Both new nonresidential and new residential permit values dropped dramatically. 
    • In 2014, Sevier County’s population contracted by approximately 70 people as the result of net out-migration.

    Sanpete County Economic Update

    Sanpete County ended the year with a nice, moderate job gain. After losing jobs for roughly a year, the county seems to have regained its employment footing in mid-2014. Industry gains appear fairly broad-based and sufficient to keep unemployment on a downward path. In addition, unemployment insurance claims remain low and sales strong. The only blot on this otherwise healthy economic portrait is a notable slowdown in construction permitting.

    • Between December 2013 and December 2014, Sanpete County created 245 net new jobs for a growth rate of more than 3 percent. 
    • Manufacturing and government generated the largest number of new positions with significant assistance from construction, retail trade, professional/business services and leisure/hospitality services. 
    • Three industries – mining, healthcare, transportation – did experience notable employment declines. 
    • Joblessness in Sanpete County continued to trend downward to register at 3.9 percent in March 2015. 
    • Currently, unemployment in Sanpete County registers at the lowest level in six years. 
    • In the first few months of 2015, first-time claims for unemployment insurance remained in an abbreviated seasonal pattern. 
    • Sanpete County’s gross taxable sales increased by almost 12 percent between the fourth quarters of 2013 and 2014. 
    • Strong sales in the business investment category provided a boost along with retail sales gains. 
    • New car and truck sales decreased slightly (5 percent) between the fourth quarters of 2013 and 2014. 
    • Construction permitting apparently slowed dramatically in 2014. 
    • New residential and nonresidential values dropped decidedly when compared to 2013. 
    • With a slight 0.8-percent increase in 2014 population, only Sanpete County experienced a population gain among the counties of central Utah. 
    • However, even in Sanpete County, roughly 300 more residents have left the county than have moved to it since 2010.

    Wednesday, February 4, 2015

    Sanpete County Economic Update

    Recently-released employment data shows that Sanpete County has dug itself out of the job-loss pit of late 2013 to early 2014. While the monthly figures were not consistently strong, they do offer a welcome improvement from prior quarters. Moreover, most industries contributed to the job creation. Concurrently, the county’s jobless rate continued on the downward track reaching the level generally considered “full employment.” Sales followed the same basic pattern as job growth with a healthy third-quarter gain—just one more indicator of an improving economy.


    Thursday, October 23, 2014

    Employment by Major Industry

    Employment by Major Industry (or Nonfarm Employment) is compiled payroll data for nonfarm workers. Nonfarm workers are all employees excluding government employees, private household employees, employees of nonprofit organizations and farm employees. DWS economists have broken these documents into county regions and are an important economic indicator of the current economic situation. For more: Why no "Farm" in Nonfarm Jobs?

    Second quarter 2014 has been updated for counties in the Central Utah region. These can be found on each county's page in the links to right, as well as below.

    Monday, June 9, 2014

    Long-term Industry Projections available on the web

    Job seekers who make decisions based on labor trends information are more likely to see payoff for their efforts. An important aspect of career exploration is understanding how occupations and industries are expected to change. To assist in this process, the Department of Workforce Services (DWS) produces long-term industry projections every two years for the major industry sectors in Utah, providing information on the state’s expected labor demands. The long-term projections extend ten years past the base year. Using the industry projections, DWS generates occupational projections for jobs that fall into the industry categories.

    To access the most recent set of long-term industry projections, click here.

    Friday, May 16, 2014

    New Data Available in Utah Economic Data Viewer

    The 2013, Q4 industry employment and wages data has been updated in the Utah Economic Data Viewer. Industry employment and wage data is collected through the Quarterly Census of Employment and Wages (QCEW) program. The primary source for QCEW data are the reports submitted by employers to the Utah Unemployment Insurance program.

    The Utah Department of Workforce Services compiles quarterly employment and wage data for non-agricultural employers in Utah. Data is maintained at the establishment level (e.g., store, plant, or other type of permanent worksite facility). Since these establishments are assigned an industry and county code, their employment and wage data can be aggregated into common industry and county groupings for analysis purposes.

    Tuesday, January 7, 2014

    Utah Employers, Employment and Wages by Size, 2013

    The Utah Department of Workforce Services compiles quarterly employment and wage data for non-agricultural employers in Utah. Data is maintained at the establishment level (e.g., store, plant, or other type of permanent worksite facility). Since these establishments are assigned an industry and county code, their employment and wage data can be aggregated into common industry and county groupings for analysis purposes.

    Employment and wage data for Utah’s non-agricultural employers are categorized in this publication by employment size for the month of March in each of the designated years. Grouping data by this criterion provides a useful tool to analyze the characteristics of Utah employers. For example, general trends of the size of Utah employers and employment concentrations by employer size class can be observed. Wage levels for large, medium, and small firms can also be evaluated.

    In this publication, data is presented for both establishments and firms. The term "establishment" is generally defined as a specific physical worksite for an employer. For most employers, this is the actual street location at which business is conducted. For others, with no permanent worksite (such as salespeople, factory representatives, or distributors) it is the location from which they conduct their business (sometimes even residences).

    For an overview of this publication and a look at your county, click here.