Showing posts with label Data. Show all posts
Showing posts with label Data. Show all posts
Tuesday, May 26, 2020
Tuesday, April 7, 2020
The U.S. Census Bureau Releases County Population Estimates for 2019
Next year, actual counts from the decennial census will be available
By Lecia Parks Langston, Senior Economist“Any time you have population growth, there are business opportunities.” Roland Dorson
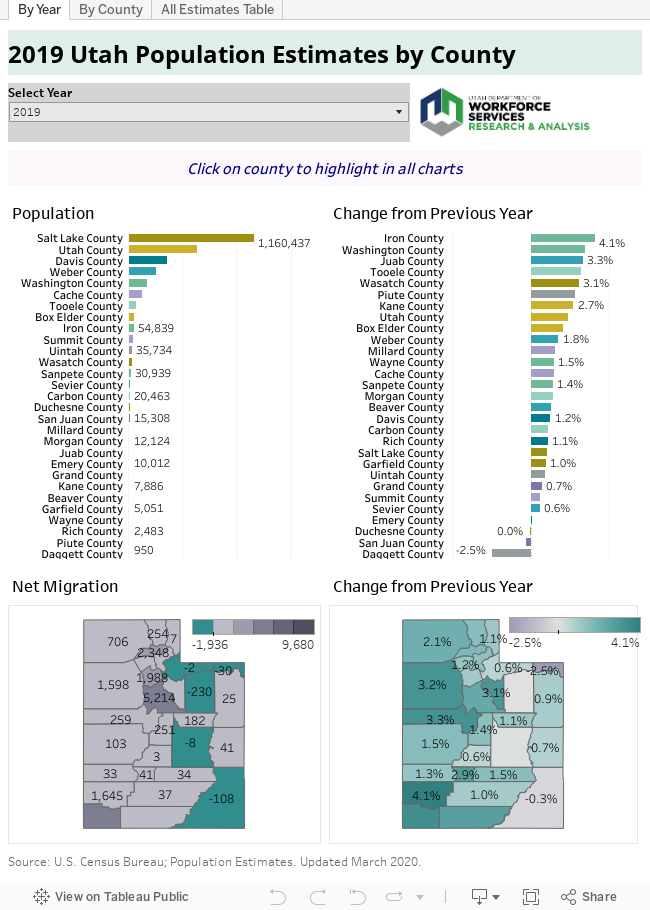
- Iron County took the lead in population growth rates for 2019 — up by 4.1%. Following close behind was its neighbor, Washington County, with a growth rate of 3.5%.
- Other fast-growing areas included counties at the edge of urban spread, such as Juab, Tooele and Wasatch.
- Although Piute County saw an increase of only about 30 individuals, its small base population also resulted in a strong percentage increase (2.9%).
- Utah County showed the highest percentage increase (2.4%) of the big-four Wasatch Front counties.
- Estimates for both San Juan and Daggett counties suggested a decline in population, while Duchesne County’s population appeared to hold steady.
- Utah County experienced the largest numeric gain in population — nearly 15,000 residents, followed by Salt Lake County (up about 12,000) and Washington County (up nearly 6,000).
- Utah and Washington counties finished neck-and-neck in the race for net in-migration. Utah County’s net in-migration measured 5,200 compared to 5,100 for Washington County.
- Several counties displayed net out-migration. Most notable on the list were Duchesne and San Juan counties. Daggett, Emery and Summit counties showed lesser out-migration estimates.
- For its size, Utah County shows a relatively high number of births and a low number of deaths, placing its natural increase not far behind population-dense Salt Lake County.
- Although Washington and Cache counties showed roughly equivalent numbers of births, deaths in Washington County measured much higher.
- In 2019, Emery County experienced its first (albeit small) population growth in more than a decade.
- Morgan County’s 2019 growth rate slipped below the state average for the first time this decade.
- Wayne County saw its best population growth (1.5%) of the past 10 years in 2019.
- Between 2010 and 2019, Wasatch County was the third fastest growing county in the nation. Washington County (St George, UT MSA) was the fifth fastest growing metropolitan area in the United States between 2010 and 2019. Its relatively small size contributes mathematically to a high growth rate. The Provo-Orem, UT MSA ranked ninth.
U.S. Census Bureau estimates use the same methodology in producing population figures for every county in the nation. Therefore, for nationwide comparisons, U.S. Census Bureau estimates may have the advantage. On the other hand, UPC population estimates have the benefit of local-analyst expertise and additional data sources.


Thursday, November 29, 2018
Updated Data Visualizations

The Utah Department of Workforce Services has recently updated the following data visualizations on our website. Click on the titles to scope out the new data:
- Intergenerational Poverty County Data
- Intergenerational Poverty Annual Report
- Interstate Migration
- Consumer Spending (Personal Consumption Expenditures)
- Utah Nonemployer Data by County
- Consumer Price Index and Cost of Living Comparisons
- Real Gross Domestic Product for Utah and Metro Areas
- Health Insurance Coverage by County
- Department of Workforce Services Job Opening by Occupation
- Occupational Rankings
- Occupational Wages by Region

Monday, January 29, 2018
Ten Years Later. . .
The Recovery Following the Great Recession
By Mark Knold, Supervising Economist and Lecia Parks Langston, Senior Economist
“The term 'business cycle' is imprecise. Economic fluctuations affect everyone, not just businesses, and they are, unlike astral cycles, anything but regular.” Kevin Hassett
Overview
December 2017 marked 10 years since the Great Recession first cast its long shadow across the American economy. The recession officially lasted 18 months, but its consequences can still be seen across the country without having to look very hard. We have not had another recession since.
Utah was hit hard at the time, losing a larger share of jobs than the national average; but, we were fortunate to be one of the most resilient states in terms of economic rebound. There are plenty of states where the Great Recession continues to weigh upon them. Employment levels in 14 states are still not back to their pre-recession peak, and another 29 states have only grown 5.0 percent or less. As the working-age population has grown by more than 5.0 percent, the job gains nationally have not been enough to fully employ working-age labor.
Utah lost 7.0 percent employment during the recession. Since that low, employment has recovered by 18 percent. That is the second best rebound in the nation. From Utah’s pre-recession employment peak to now, Utah’s employment has increased by 9.5 percent, third best in the nation. Yet, Utah’s job growth has not been enough to absorb all of the labor force growth during that time. Utah’s unemployment rate is low, but the percent of the working-age population in the labor force is several percentage points below the pre-recession norm — telling us that potential labor is still not as fully engaged with the job market as before the recession.
As a whole, Utah has had a notable recession rebound, but those gains have not been shared equally across all regions. Just like the national profile, some areas have bounced back strong while others are still lagging behind. The state’s metropolitan areas have grown well, but many of Utah’s rural areas cannot say the same. Nine counties have employment levels below their pre-recession peaks.
In this issue of Local Insights, we profile Utah’s regional and county economies in light of the 10-year span since the Great Recession.
Central Utah and the Recovery
The five counties in Central Utah — Millard, Piute, Sanpete, Sevier and Wayne — each experienced the Great Recession and the ensuing recovery in their own way. However, in general, the area was slow to join the recovery job-creation party. Most counties participated in the pre-recession boom in only a minor fashion. Yet all suffered from the national downturn. Several counties in Central Utah have yet to regain their prerecession employment levels despite a national recovery of more than 100 months.
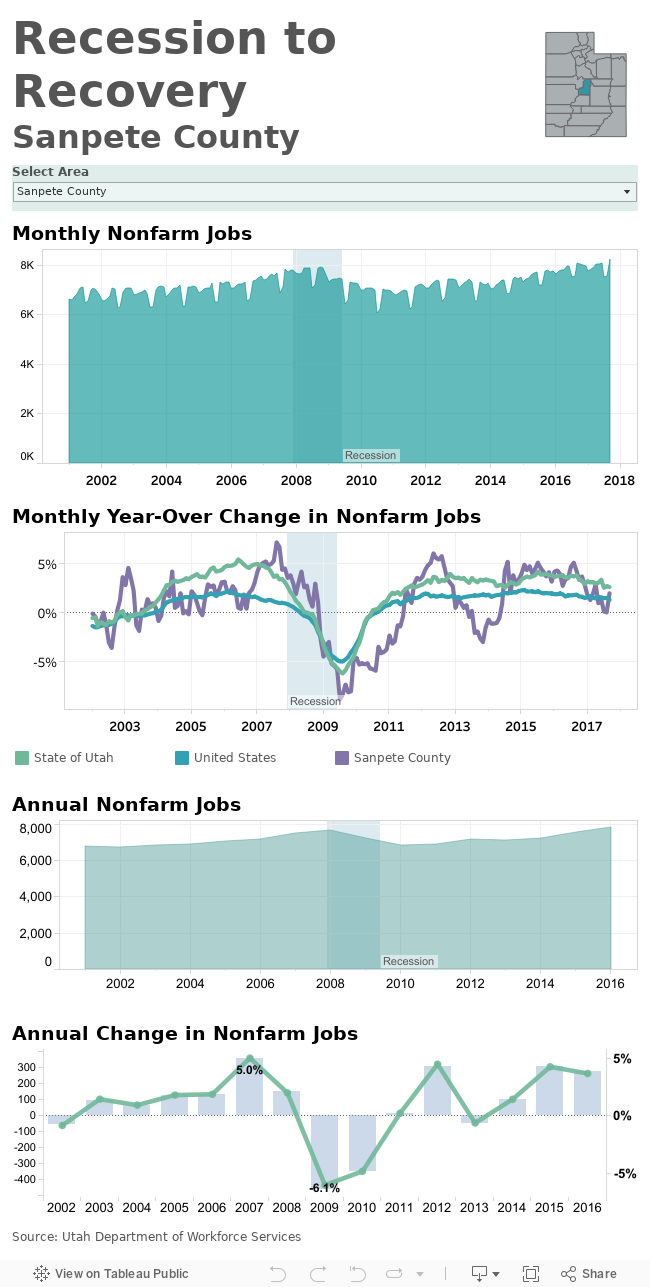
Sanpete County
Sanpete County was one of the few in the region to experience a surge of employment during the pre-bust boom. Employment peaked in 2008 at nearly 7,700 nonfarm jobs. Employment totals bottomed out in 2010, after an 11-percent, 800-job decline, then held steady through 2011. A surge in employment during 2012, collapsed in 2013. The county then experienced strong expansion until 2016, when job growth slowed somewhat. While Utah had regained its pre-recession employment level by 2013, Sanpete County took an additional three years to surpass its 2008 employment total.
Thursday, June 1, 2017
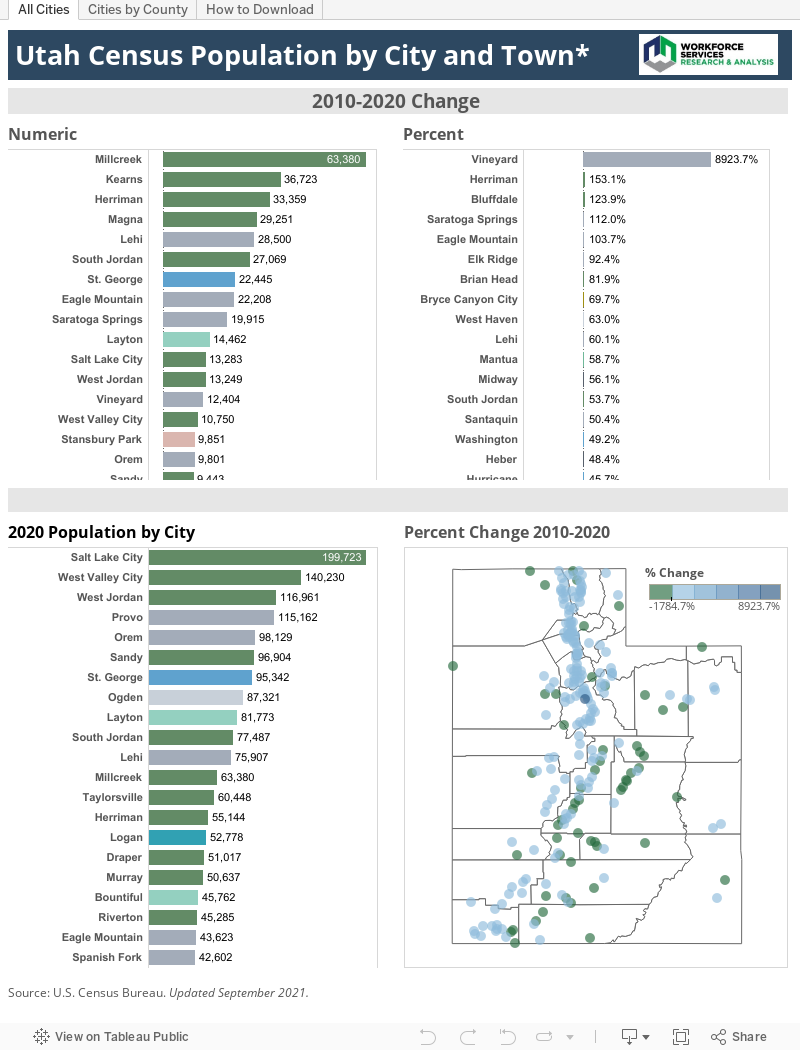
Is Your Town Growing?
U.S. Census Bureau releases 2016 City Population Estimates
By Lecia Parks Langston, Senior Economist
“A city is more than a place in space, it is a drama in time” –Patrick Geddes
Most of Utah’s cities and towns grew in 2017, according to population estimates recently released by the U.S. Census Bureau. Lehi even ranked 11th among the nation’s fastest-growing large cities. However, not all Utah’s cities and towns experienced growth.
Use the visualization and bullet points below to explore population trends for individual townships.

• The old Geneva Steel Mill site continues to be fertile ground for population expansion. Vineyard was once again the fastest growing city in Utah. However its rate of growth has slowed dramatically since 2015. In addition, Vineyard remains relatively small in size.
• Herriman added the highest number of new residents of any city in Utah (4,550) followed by Orem, Lehi and South Jordan. All showed higher population gains than Salt Lake City — Utah’s most populous city. Herriman also showed the second-fastest rate of expansion in 2016.
• St. George was the only city outside the Wasatch Front to increase its population by more than 2,000 residents.
• The top four population-gaining cities in Utah are all located in southern Salt Lake County or northern Utah County, as the metropolitan population continued to spread outward from the large city centers. Fastest-growing larger communities also tended to be located near the Salt Lake County/Utah County border.
• Due to the nature of percent-change mathematics, several small towns (such as Monticello, Mantua, Francis, Interlaken and Hideout) showed high growth rates although their new-resident counts measured relatively low.
• The Census Bureau estimates that most of the cities and towns showing population declines were located in the Uintah Basin, Carbon County and Emery County. Declines in resource-based employment have spearheaded these population declines.
• In addition, Millard, Piute, Garfield and Wayne counties displayed a significant number of contracting townships.
• Salt Lake County remains home to five of the 10 largest cities in the state. Utah County accounts for another two in the top 10. St. George is the only city in the top-10 ranking located outside the Wasatch Front.
Thursday, April 27, 2017
Census Bureau Tool Provides Labor-Force Insight for Utah
By Mark Knold and Lecia Langston
Across the United States, jobs are quantified through each state’s unemployment insurance program. Those programs provide the potential for laid-off workers to receive unemployment benefits — the goal being to bridge the gap between workers’ lost jobs and their next jobs. An eligible recipient’s weekly benefit amount is based upon their earnings from recent work. This begs the question, how does Utah’s unemployment insurance program know how much an individual recently earned while working?
That answer is supplied by all businesses that hire workers, as they must report their employees and pay as mandated by the unemployment insurance laws. Companies identify their individual workers and those workers’ monetary earnings for a calendar quarter. As businesses are identified by their industrial activity and geographic location, it is through the unemployment insurance program that aggregate employment counts by industry and location are calculated.
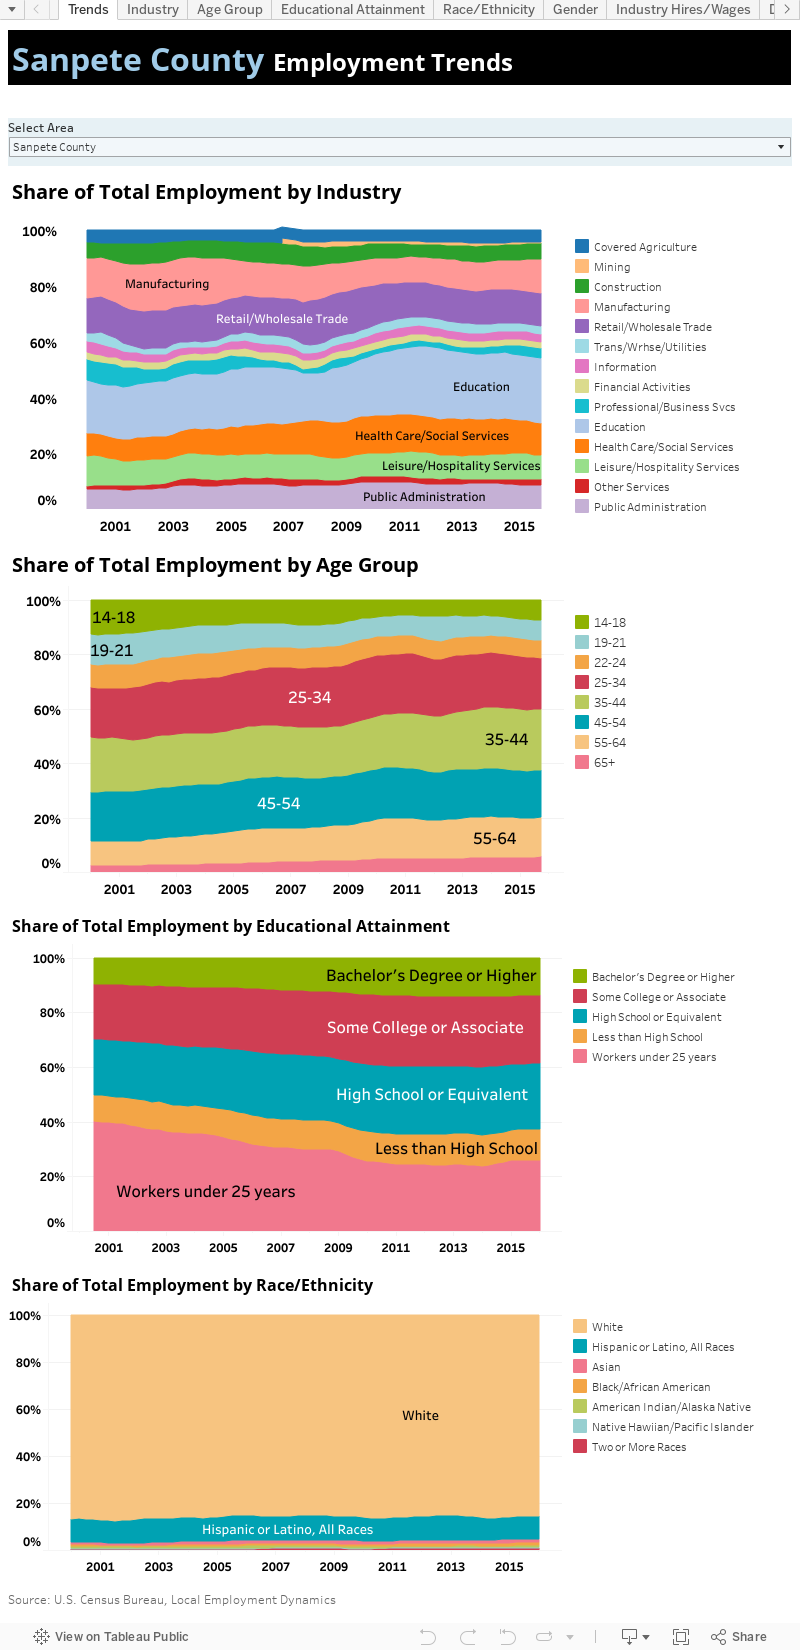
Yet each state’s profiling of individuals is quite minimal in the unemployment insurance program. The U.S. Census Bureau can bring more light to the overall labor force by supplementing said information with gender, age, race/ethnicity and educational attainment (imputted from American Community Survey responses) for Utah’s labor force.
The Census Bureau packages this information through their Local Employment Dynamics program and makes available said data on its website. Here at the Department of Workforce Services, we recently downloaded and packaged Utah-specific data from said website and summarized it in the attached visualization.
Various data “tabs” are available, presenting Utah’s economy from different angles, ranging from industry shares within the economy to the age-group distributions of the labor force, to gender and race distributions. These labor variables can be viewed for the state as a whole, or by each individual county.
That answer is supplied by all businesses that hire workers, as they must report their employees and pay as mandated by the unemployment insurance laws. Companies identify their individual workers and those workers’ monetary earnings for a calendar quarter. As businesses are identified by their industrial activity and geographic location, it is through the unemployment insurance program that aggregate employment counts by industry and location are calculated.
Yet each state’s profiling of individuals is quite minimal in the unemployment insurance program. The U.S. Census Bureau can bring more light to the overall labor force by supplementing said information with gender, age, race/ethnicity and educational attainment (imputted from American Community Survey responses) for Utah’s labor force.
The Census Bureau packages this information through their Local Employment Dynamics program and makes available said data on its website. Here at the Department of Workforce Services, we recently downloaded and packaged Utah-specific data from said website and summarized it in the attached visualization.
Various data “tabs” are available, presenting Utah’s economy from different angles, ranging from industry shares within the economy to the age-group distributions of the labor force, to gender and race distributions. These labor variables can be viewed for the state as a whole, or by each individual county.
Health Insurance: Who’s covered in Utah?
Census Bureau Estimates Provide Answers about Utah Health Insurance Coverage
By Lecia Parks Langston, Senior Economist
“Most Americans want health insurance.” Jacob Lew
Tracking Utahns Under 65 Years of Age
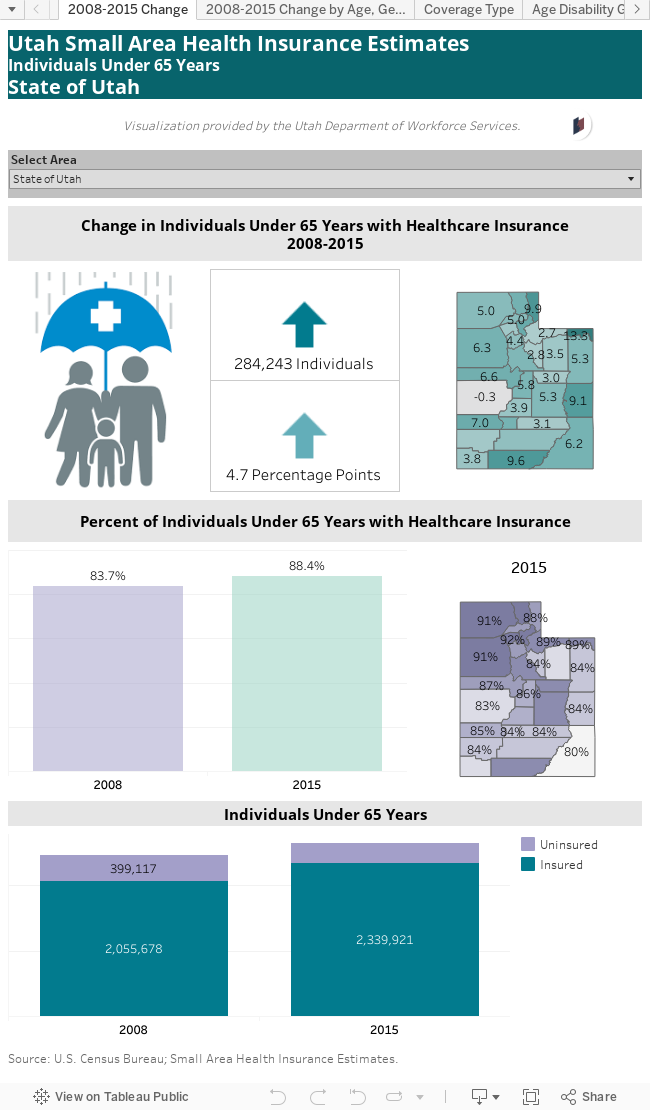
Between 2008 and 2015, the number of Utahns under 65 years old covered by health insurance increased by 284,000. Not only did the actual covered increase, but the share of non-senior population with health insurance also gained ground expanding from less than 84 percent to more than 88 percent — an increase of 4.7 percentage points.
Only Millard County experienced a very slight 0.3 percentage point decline in health insurance coverage although the actual number of persons covered increased by 113. Daggett, Rich, Kane and Grand counties showed the highest growth in under-65 coverage; each showed increases of at least 9 percentage points.
In 2015, counties in northern Utah generally showed the highest level of non-senior health insurance coverage. In Morgan, Davis, Box Elder, Tooele and Cache counties, health insurance rates top 90 percent. On the other end of the scale, rural counties in central and southern Utah display the lowest coverage. In San Juan, Millard, Duchesne and Wayne counties, health insurance rates for those under 65 measured 83 percent or less.
Those under 19 saw the greatest gains. Coverage rates for these young people increased from 87 percent in 2008 to 93 percent in 2015. Utah males experienced a larger gain in coverage between 2008 and 2015 (5 percentage points) than did females (4 percentage points), although females were more likely than men to carry health insurance in both years. Health insurance rates for those with the lowest incomes showed the most improvement (10.4 percentage points). However, their coverage shares remain roughly 10 points below average.
Wait, There’s More…
Friday, March 31, 2017
U.S. Census Bureau releases 2016 county population estimates.
By Lecia Parks Langston, Senior Economist
“In a region with a growing population, if you’re doing nothing, you’re losing ground.” Stewart Udall
The Census Bureau just released population estimates for counties and metropolitan statistical areas across the United States. Yes, it was just a few months ago that Utah made headlines as the fastest-growing state in the nation. So, it should come as no surprise that several Utah sub-areas also appeared on the fastest-growing lists.
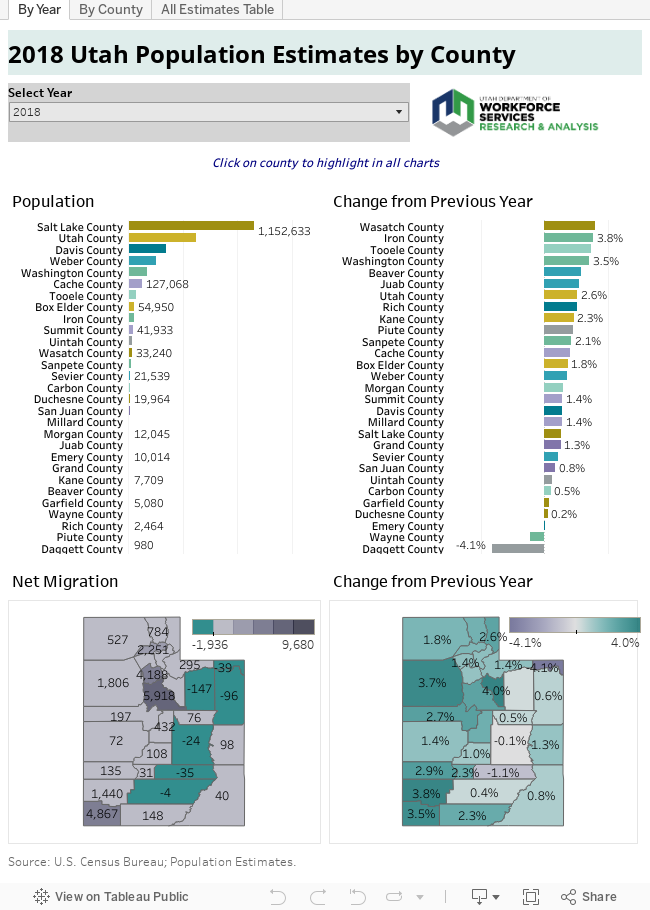
San Juan County ranked as the fastest growing county in the nation with a 2016 growth estimate of 7.6 percent. Keep in mind that less than 17,000 people live in the county. In other words, a small numeric change in this less-populated county can result in a large percent change.
In addition, three Utah regions ranked among the top 20 fastest-growing Metropolitan Statistical Areas in the country. The St. George, Utah MSA (sixth), Provo-Orem, Utah MSA (seventh) and the Logan, Utah-Idaho MSA (20th) all attained top-20 status. See additional information on the estimates after the “jump.”
Pick a Number, Any Number
Because the Census Bureau actually counts the population only once every decade, these figures are estimates. Plus, they aren’t the only estimates in town. The Kem C. Gardner Policy Institute has recently assembled the Utah Population Committee (UPC) to reinstitute the population-estimates work previously conducted by the Utah Population Estimates Committee (UPEC). The estimates can be found here.
Census Bureau estimates use the same methodology in producing population figures for every county in the nation. Therefore, for nationwide comparisons, Census Bureau estimates may have the advantage. On the other hand, UPC population estimates have the benefit of local-analyst expertise and additional data sources.
Wednesday, March 15, 2017
Sevier County Construction Permitting
Sevier County experienced an increase of more than $2 million in the value of residential building permits issued in 2016 as compared to 2015. The county issued 48 building permits, six of which for manufactured homes, for a total value of $10.6 million.
While residential construction was up in the county, commercial construction went down from 12 permits in 2015 to six in 2016. The total valuation for commercial building permits in the county went from $3.39 million in 2015 to $1.54 million in 2016. Richfield Reaper
While residential construction was up in the county, commercial construction went down from 12 permits in 2015 to six in 2016. The total valuation for commercial building permits in the county went from $3.39 million in 2015 to $1.54 million in 2016. Richfield Reaper
Tuesday, February 14, 2017
Better, Faster, Smarter . . .Check out our new website design
Depending on the subject, economic data can be categorized as either broad or specific. For example, the demographic makeup of an area and how that impacts an economic structure is a broad-subject approach. Conversely, a current monthly snapshot of the Utah economy, its job growth and unemployment rate is a more specific observation. Our economic webpage has four “portals” through which to “categorize” and search for information. One portal is broad, while the other three are more specific in nature.
Topic Portals
The monthly employment profile just mentioned is a specific
topic and gets its own “portal,” entitled Employment Update. Here, the most
current Utah economic performance can be explored and summarized. The
information found here is what often gets cited in the local news media in
reference to the current Utah job performance and unemployment rate.
The second specific “portal” is labeled Local Insights. This
is a quarterly profile of the Utah economy down to a county level. Each county
is summarized with its own economic performance, including job growth,
unemployment rate, housing starts, taxable sales and other profile variables.
The common theme here is a county-specific approach.
The third specific “portal” is Reports and Analysis.
Workforce Services’ economic forte is the labor market. Things over and above
the everyday reporting on the labor market are presented here. Sometimes we do
special economic studies, other times we will report on specific economic
groups within the labor force, like women or veterans. Anything we do that is
not an often repeated or ongoing report are grouped here.
The final “portal,” and possibly the one that will be most
used, is labeled Economic Data. The core of our data collection and analysis is
concentrated here. Employment data, occupational data, wage information and
demographic profiles are just some of the major economic themes found in this
area.
FRED's on site
As mentioned earlier, we have added an economic indicator
area tapping into FRED, which is a massive compilation of economic data from various
sources — primarily government statistical agencies, but also some nongovernmental
organizations. Workforce Services economists have gone through the list and
selected a handful of the most useful data series for gauging the performance
of Utah’s macro economy and gaining insights into expected trends. Utah
functions within the national economy, so the national economic indicators
profiled here are intended to also be guiding influences on the Utah economy. These
indicators include composite indexes; a recession probability indicator;
leading indicators, such as construction permits and the yield curve;
coincident indicators, such as real GDP and employment; and price indicators,
such as the consumer price index, regional housing prices, and oil and gas
prices. Each chart has a detailed description of what the data represent and
how they may be useful.
Keeping relevant with the fast-changing pace of the Internet
and data presentation is our goal at Workforce Services. We hope these changes
help to better present our broad package of economic data offerings.
Tuesday, August 2, 2016
Wayne County Economic Update
Wayne County’s labor market shot up dramatically in the first few months of 2016. First quarter 2016 marks more than a year’s worth of nonfarm job growth. While the expansion rates have proved erratic, this vacillating behavior is common among small counties. Not only is the employment base expanding, but most industries sported membership in the job-creation club. Joblessness seems to have stalled at a relatively high level, not uncommon to tourism-driven economies. Although the unemployment rate remains high, first-time claims activity remains low suggesting layoffs are not playing a present-day role. Early 2016 growth in both construction and sales also points towards an improving economy.

- Wayne County’s nonfarm employment showed expansion between March 2015 and March 2016 with almost 90 new jobs and a year-over growth rate of nearly 11 percent.
- Retail trade and leisure/hospitality services added the largest numbers of new employment, ranking first and second in employment creation.
- Government, construction and healthcare/social services also contributed to the new job totals.
- Industry-level job losses were virtually nonexistent.
- After edging down for the better part of two years, Wayne County’s jobless rate seems to have stalled.
- The county’s June 2016 unemployment rate of 8.4 percent reflects a seasonal, tourism-driven economy.
- First-time claims for unemployment insurance are currently following a seasonal pattern suggesting that no unusual layoff activity has occurred so far in 2016.
- The leisure/hospitality services industry has generated the lion’s share of new claims so far this year.
- The county’s average monthly wage has slowly edged upwards in fits and starts.
- The first quarter 2016 wage took a breather from the ascending trend displaying virtually no change since first quarter 2015.
- Construction permitting was off to a rapid-fire 2016 start with the authorization of several large nonresidential projects. In the first three months of 2016, residential permitting ran slower than in the same time period in 2015.
- Gross taxable sales increased at a robust 12-percent rate between the first quarters of 2015 and 2016.
- Accommodations, food services and general merchandise stores showed the highest sales gains.
Sanpete County Economic Update
Sanpete County rang in the new year with another quarter of strong economic growth. Nonfarm jobs showed solid gains and broad-based expansion. In contrast, joblessness has edged up in recent months. Strong employment expansion coupled with a dearth of unseasonal unemployment insurance claims activity suggests the rise is the result of workers entering and re-entering the labor market. Gross taxable sales expanded nicely falling in line with employment growth. Despite the recent uptick in unemployment, most indicators illustrate a healthy Sanpete County economy.
Between March 2015 and March 2016, Sanpete County added more than 280 new nonfarm jobs for a year-over growth rate of nearly 4 percent.
Manufacturing produced the largest number of new jobs with healthcare/social services, retail trade and professional/business services contributing notable numbers of new positions.
The only significant job loss occurred in leisure/hospitality services.
Following Utah’s lead, Sanpete County’s unemployment rate has increased in recent months.
However, at 4.4 percent in June 2016, joblessness remains relatively low from an historical perspective.
During the first half of 2016, new unemployment insurance claims followed the seasonal pattern of the past several years with no sign of cyclical layoffs.
Thanks to its project-to-project nature, construction accounted for a large share of current 2016 claims activity.
Sanpete County’s average monthly nonfarm wage continues to slowly improve.
However, the year-to-year increase for first quarter 2016 proved lower than usual – less than 1 percent.
Current construction data is not available for Sanpete County.
Gross taxable sales showed a strong 8.5 percent increase between the first quarters of 2015 and 2016.
Prior-period adjustments and business investment expenditures accounted for much of the addition although food/beverage stores, general merchandise stores and private motor vehicle sales all made solid showings.
Millard County Economic Update
After a strong 2015 ending, Millard County’s employment picture clouded at the beginning of 2016. In first quarter 2016, nonfarm employment showed little change from comparable totals for the previous year. On an industry level, performances roamed all over the map with some industries experiencing strong expansion and other industries contracting. With this spotty employment experience and an unseasonal increase in first-time claims for unemployment insurance, the current uptick in joblessness is only to be expected. On the plus side, thanks to solar farm permitting, construction values improved substantially in first quarter. And while much of the reported gross taxable sales gain resulted from a prior-period adjustment, current sales increased nicely as well. Slow job growth and variability in the other recent indicators suggests the economy shows room for improvement.
In the 12 months prior to March 2016, Millard County created only 13 new positions for a year-to-year change of 0.3 percent.
Strong employment gains in construction, professional/business services and private educational services were basically offset by employment contraction in retail trade, information and leisure/hospitality services.
An additional 23 covered agricultural jobs are not included in the nonfarm totals.
Slower job growth coupled with construction layoffs in late spring to nudge Millard County’s unemployment rate up to 3.7 percent in June 2016.
However, the county’s jobless rate remains relatively low.
First-time claims for unemployment insurance took an unseasonal spike in late spring/early summer.
The construction industry contributed the largest number of new claims so far in 2016.
Millard County’s average monthly nonfarm wage continues to trudge upwards.
Between the first quarters of 2015 and 2016, the average wage increased by a healthy 4 percent.
With little construction permitting data available so for this year, new nonresidential permits are dominating figures.
Permitting for the solar farm can claim primary credit for the current high figures.
The reported 49-percent increase in first quarter 2016 gross taxable sales shrinks to only 10 percent when prior-period adjustments are removed.
Of course, 10-percent expansion is still certainly robust.
Much of the current gain can be traced to increased business investment expenditures.
Monday, May 23, 2016
Some Central Utah cities lost population during 2015
The U.S. Census Bureau releases 2015 population estimates for cities
By Lecia Parks Langston, Senior Economist“I come from a small town whose population never changed. Each time a woman got pregnant, someone left town.” Michael Prichard
The U.S. Census Bureau just released 2015 population estimates for cities and towns. In the visualization below, you can check out the estimates for your own Utah hometown. Use the “Cities by County” tab to easily locate a particular township.
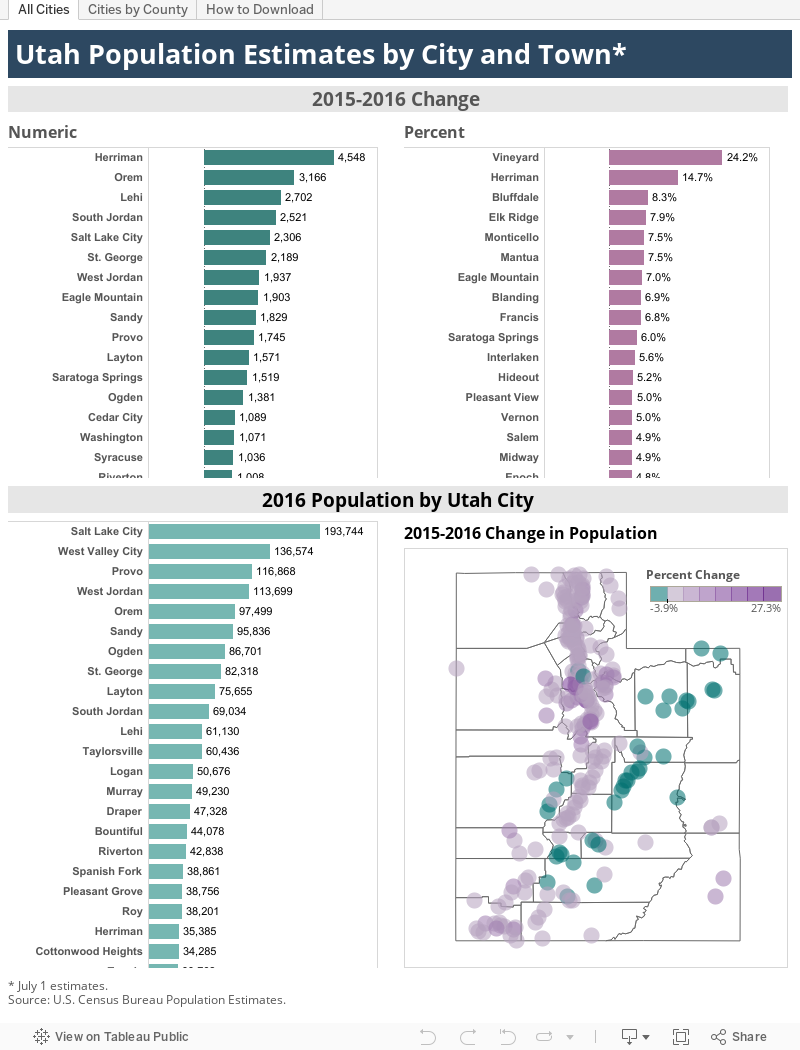
While most cities in Utah expanded during 2015, they presented a wide variety of growth experiences.
• The old Geneva Steel Mill site has proved fertile ground for population growth. Vineyard, Utah, which is located on the spot, grew by a whopping 418 percent in just one year. However, Vineyard’s population remains relatively low in the overall scheme of things with about 3,200 residents.
• South Jordan added the largest number of persons (roughly 3,800) of any Utah city or town. South Jordan also ranked fifth in the nation for 2015 population growth (among cities with populations of 50,000 or more).
• The top five population-gaining cities in Utah are all located in southern Salt Lake County or northern Utah County as the metropolitan population continues to spread outward from the large city centers. Fastest-growing larger communities also tended to be located near the Salt Lake/Utah County border.
• Due to the nature of percent changes, several small towns (Ophir, Ballard, Francis, Wallsburg) showed high growth rates although their new-resident counts measured relatively low.
• Census estimates suggest a number of towns lost population in 2015. Every town in Carbon, Emery and Wayne counties showed contraction. In addition, Kanab and Beaver City experienced notable population declines.
• Salt Lake County remains home to five of the 10 largest cities in the state. Utah County accounts for another two in the top 10. St. George is the only city in the top-10 ranking located outside the Wasatch Front.
Wednesday, May 18, 2016
Mixed results in health insurance coverage in Central Utah
The Census Bureau Releases 2014 Small Area Health Insurance Estimates
By Lecia Parks Langston, Senior Economist
“Poverty and no health insurance coverage keeps the doctor away — apples have nothing to do with it.” Beryl Dov
The goals of the Affordable Care Act (ACA) include expanded health insurance coverage in the United States. Most of the Act’s health insurance expansion provisions went into effect January 1, 2014. The U.S. Census Bureau’s recently-released 2014 Small Area Health Insurance Estimates provide an initial glimpse of the early outcomes of ACA on health insurance coverage. Keep in mind that health insurance coverage runs the gamut from employer-provided plans to personal insurance to government Medicaid and Medicare coverage. These estimates cover individuals under the age of 65, since those 65 and older are eligible for government-provided health insurance through Medicare.
Has health insurance coverage has expanded in the Beehive State? The percentage of individuals in Utah with health insurance coverage did increase between 2009 and 2014. In 2008, 83.7 percent of the population under age 65 had some sort of health insurance according to the Census Bureau estimates (based on the American Community Survey data). By 2014, coverage had increased by an additional 2.5 percentage points to measure 86.2 percent.
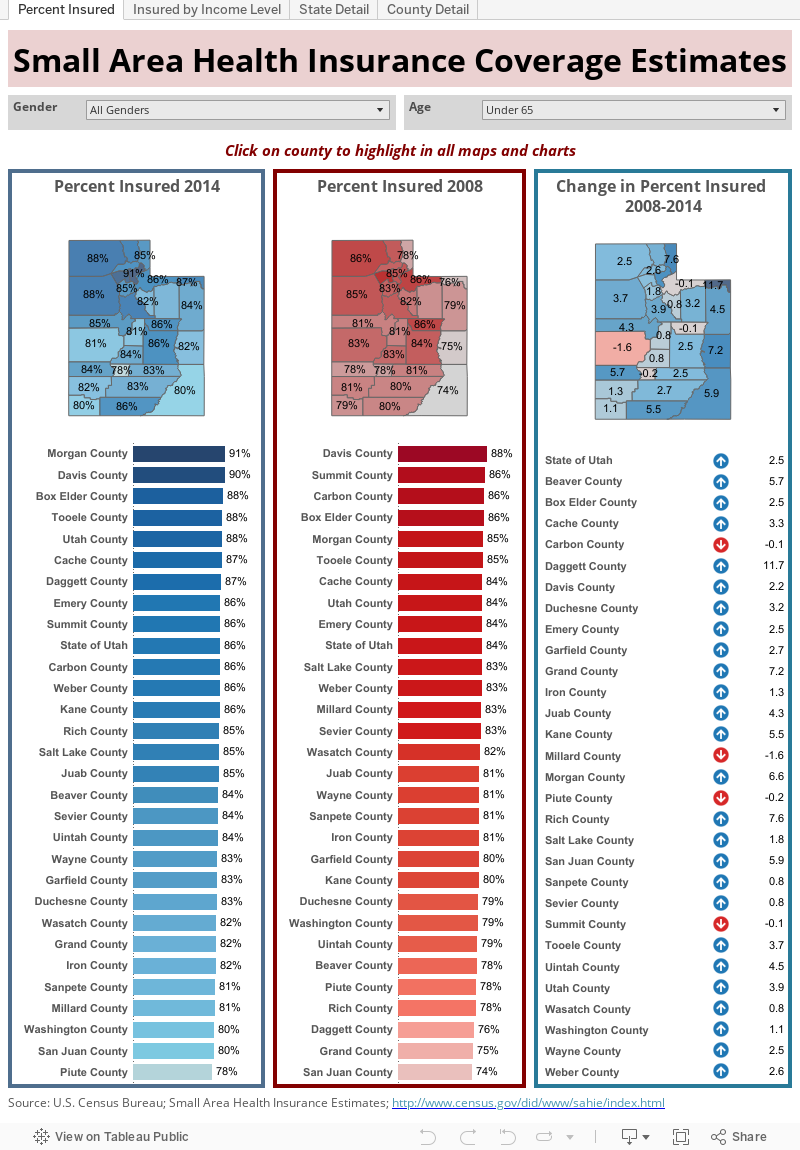
Gains in the percentage of insured proved particularly strong for African Americans and Latinos. Coverage for black Utahns increased by 5 percentage points while Hispanics experienced a notable 8 percentage-point gain. In contrast, white (not Hispanic) coverage increased by only 1.8 percentage points between 2008 and 2014.
Males (up 2.7 points) were slightly more likely than females (up 2.2 points) to experience an increase in the insured share of the population. Latino males experienced the strongest expansion, the percent of insured rose 9.1 percentage points between 2008 and 2014.
The Census Bureau provides health-insurance categories ranging from at-or-below-138 percent of poverty to at-or-below-400 percent of poverty. Those with the lowest incomes experienced the greatest increase in coverage (up 6.6 points). However, lower-income individuals are still insured at a lower rate than their higher-income peers. For example, only 73.6 percent of those at or below 138 percent of poverty are insured compared to 86.2 percent of the general population.
Counties in the northern part of the state tend to show the highest shares of insured individuals. In 2014, Morgan, Davis, Box Elder, Tooele and Utah counties all showed insured shares of 88 percent or higher. On the opposite end of the scale, many counties in central and southern Utah showed low insured rates. In Piute, San Juan, Washington, Millard and Sanpete counties, 81 percent or less of the population under the age of 65 had health insurance.
While most counties shared in the state’s increasing health insurance coverage, Carbon, Millard, Piute and Summit counties all showed a slight decrease in the share of insured individuals less than 65 years of age. However, the estimated declines are well within the margin of error for these counties, which suggests that coverage might not have declined at all. In general, the largest increases in health insurance coverage occurred in small counties — Daggett, Beaver, Grand, Kane, Morgan and San Juan counties.
Tuesday, January 26, 2016
Wayne County Economic Update
In third quarter 2015, Wayne County held on to the job growth it started earlier in the year. While the improvement is welcome, several industries did take an employment hit. Unemployment rates in the area continue to slowly trend downward. That’s welcome news for this county with the third highest jobless rate in the state. Wayne County continues to struggle with the loss of employment opportunities associated with the closure of its largest employer several years ago. On the positive side, first-time claims for unemployment insurance show a typical seasonal pattern with no significant sign of layoffs. Both sales and construction also demonstrated recent improvement. All in all, the county seems on the road to recovery.
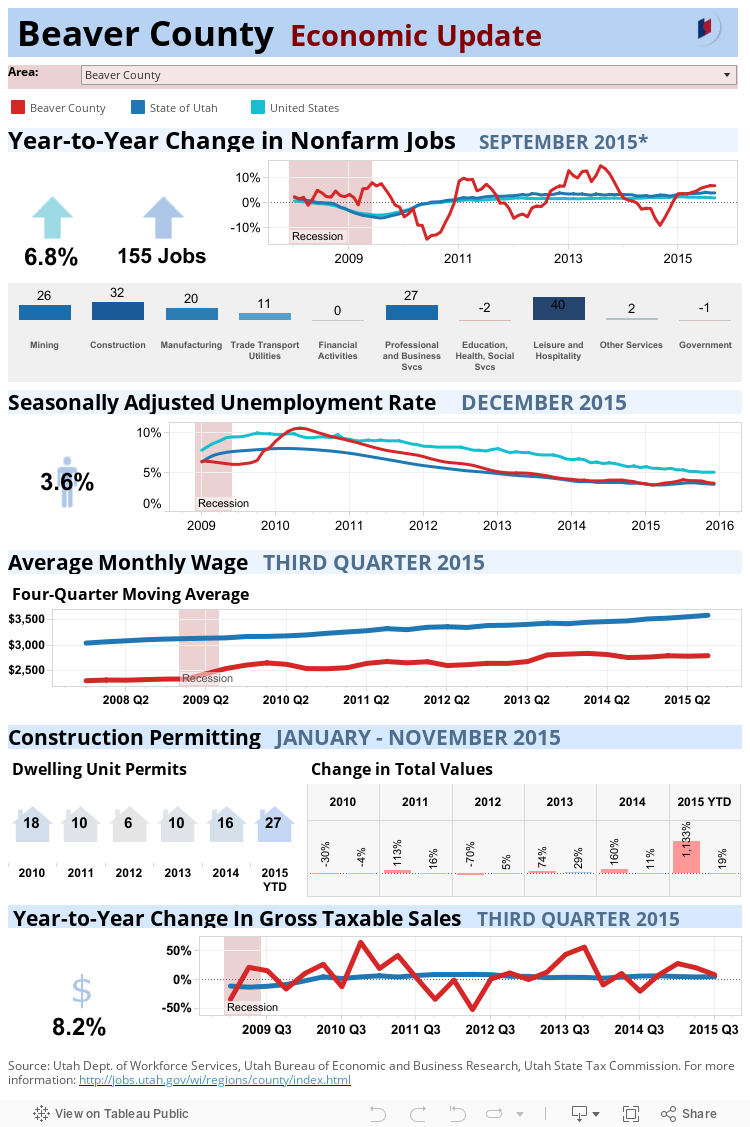
- Wayne County added more than 60 new jobs to its nonfarm jobs total between September 2014 and September 2015.
- Jobs were up a robust 6 percent in September and the county has not shown a job loss since February 2015.
- Leisure/hospitality services and healthcare/social services both experienced notable year-to-year contractions.
- Growth in construction, retail trade and the public sector more than counteracted the aforementioned losses.
- While Wayne County registered the third highest unemployment rate in the state in December 2015 (8.7 percent), it has seen its rate dip slightly over the past year.
- In late 2015, unemployment insurance claims data displayed a typical seasonal pattern with no sign of cyclical distress.
- Although the county’s average monthly wage had flattened earlier in the year, the county managed a strong 5-percent wage gain between the third quarters of 2014 and 2015.
- For the first 11 months of 2015, Garfield County’s construction permit totals are up by a healthy 25 percent when compared to the same time period in 2014.
- Residential permitting was behind the gain with nonresidential building basically holding its own.
- Third quarter 2015 gross taxable sales jumped by 9.2 percent over third quarter 2014 figures.
- Sales at food stores, accommodations and food services showed the most obvious increases.
Sevier County Economic Update
With almost two years of job growth under its belt, Sevier County's economy seems healthy with most industries joining in on the expansionary trend. Joblessness has changed little over the year and remains relatively low. Plus, no undue signs of stress have appeared in the unemployment insurance claims which have rolled along at a seasonal pace. Construction permitting appears to be holding ground and sales have shown improvement in all but one quarter during the past three years.
- Between September 2014 and September 2015, Sevier County generated almost 220 new jobs for a growth rate approaching 3 percent.
- Government proved the only major sector with employment declines, and that loss was barely noticeable.
- Leisure/hospitality services contributed the largest number of new positions with resilient advances in health/social services, transportation and retail trade.
- The county’s unemployment rate has shown slight ups and downs during the past year, but the December 2015 figure remains relatively low at 4.3 percent.
- New claims for unemployment insurance followed a seasonal pattern as 2015 came to a close with no significant nonseasonal layoffs.
- Construction, professional/business services and leisure/hospitality services accounted for the largest shares of first-time claims.
- The county’s average monthly wage continued to increase. Year-to-year growth in the third quarter 2015 average wage proved particularly strong at 6.5 percent, although these growth rates can be fairly erratic.
- Construction permitting values appear to be holding their own with a 10-percent increase for the first 11 months of 2015.
- Third quarter 2015 gross taxable sales showed a moderate 3-percent year-over gain in Sevier County.
- In general, retail sales appeared vigorous with building materials/garden stores showing a decided increase.
Sanpete County Economic Update
For the past year, Sanpete County has found itself back in the economic highlife. In third quarter 2015, the rate of employment expansion continued to improve with fairly broad-based industry participation. Joblessness has held fairly steady over the past year at what certainly can be considered a full-employment level. No significant nonseasonal layoffs are apparent in the pattern of first-time unemployment insurance claims. Construction permitting exhibited strong gains as did gross taxable sales. All in all, the economy appears strong and healthy.
- Sanpete County pumped out more than 360 jobs between September 2014 and September 2015, for a year-to-year growth rate of almost 5 percent.
- Most major industries experienced expansion with only mining and leisure/hospitality services showing minor contraction.
- Public-sector employment at the state and local level led the job-creating industry pack.
- However, construction, manufacturing, retail trade and professional/business services all made strong contributions as well.
- Joblessness seems to have bottomed out at 3.7 percent in December 2015.
- The county has seen little change in unemployment rates over the past year.
- First-time claims for unemployment insurance showed a typical seasonal pattern as 2015 came to a close. The number did run slightly above 2014, but poses no cause for concern.
- Thanks to its project-to-project nature, construction accounted for a large share of 2015 claims activity.
- Sanpete County’s average monthly nonfarm wage continued to improve. Between the third quarters of 2014 and 2015, the increase proved particularly robust (3.7 percent).
- In the first 11 months of 2015, Sanpete County’s nonresidential permit values increased a dramatic 550 percent when compared to 2014.
- The number of new home permits rose in 2015 compared to 2014, but remains low from an historical perspective.
- Gross taxable sales generated its eighth straight quarter of expanding sales. Between the third quarters of 2014 and 2015, sales increased by a robust 7 percent.
- Sales proved solid in most retail categories, although building materials/garden stores accounted for a notable portion of the overall gain.
Piute County Economic Update
After a brief fling with job growth, Piute County once again found itself in the job-loss trenches in third quarter 2015. The decline represents few jobs and would be less troubling if not for the county’s relatively consistent history of job loss. Despite a sluggish job environment, the county’s unemployment rate has held relatively steady over the past year and there is no sign of unusual activity in new unemployment insurance claims. In contrast with the job market, sales exhibited a strong third quarter performance. Piute County’s economy must consistently create jobs before it can be ruled economically healthy.
- Piute County lost nine jobs between September 2014 and September 2015 resulting in a year-to-year decline of almost 4 percent.
- Industry-level job increases proved virtually nonexistent.
- Leisure/hospitality services and retail trade experienced the largest employment declines.
- In December 2015, Piute County’s unemployment rate measured 6.8 percent, equal to its December 2014 figure.
- Piute County can absorb job losses without an increase in unemployment rates because many workers travel outside the county for employment.
- First-time claims for unemployment insurance followed a seasonal pattern as 2015 came to end with the largest number of claims filed in the construction industry.
- The county’s average monthly wage actually showed a 10-percent year-to-year gain in third quarter 2015.
- However, quarterly wage increases are notoriously fickle, particularly in a small county.
- Gross taxable sales bounced back from losses earlier in the year with a robust 15-percent third quarter increase.
- Strong sales in food stores, recreation and gasoline stations accounted for much of the improvement.
Millard County Economic Update
After more than two years of expansion, Millard County took a break from job growth in the third quarter of 2015. Although jobs picked up a bit by quarter-end, public-sector losses hampered labor market growth. However, other economic indicators currently show no signs of distress. New claims for unemployment insurance are basically holding in a seasonal pattern and jobless rates remain low. Construction permitting proved robust in 2015 and sales showed a sturdy third-quarter gain. The current slowdown may prove temporary but certainly bears watching.
- Between September 2014 and September 2015, Millard County added 20 new jobs for a tepid growth rate of 0.5 percent.
- Declines in state and local government employment proved the major factor in the employment growth slowdown. Utilities and manufacturing also suffered notable losses.
- On the positive side of the ledger, wholesale trade, private education/health/social services and leisure/hospitality services all generated significant numbers of new positions.
- Despite the public-sector losses, Millard County’s unemployment rate has held relatively steady for the past two years at a low rate.
- In December 2015, joblessness measured 3.5 percent, unchanged from a year earlier.
- In addition, with the exception of a blip in early autumn, first-time claims for unemployment insurance seem to be holding in a seasonal pattern.
- While job growth paused, the county’s average wage actually ticked up a notch.
- Third quarter showed a particularly healthy 3.5-percent year-to-year gain.
- Nonresidential permitting for industrial buildings took the lead in generating a 57-percent increase in total values for the first 11 months of 2015.
- The number of new home permits held steady when compared with 2014.
- With almost a 7-percent increase, Millard County’s gross taxable sales turned in a strong third quarter performance.
- Much of the rise can be traced to a prior-period adjustment. However, retail trade, accommodations and food services all showed notable gains.
Subscribe to:
Posts (Atom)