Showing posts with label Wages. Show all posts

Wednesday, July 26, 2017

“New and Improved?” A look at the Retail Trade Industry in Central Utah

By Mark Knold, Supervising Economist and Lecia Parks Langston, Senior Economist

“Almost no one wants to admit the genius of Jeff Bezos and Amazon. Apparently, many have failed to see that Amazon has become the world's biggest retail company.” Hubert Burda

Consumer spending makes up around 68 percent of the nation’s gross domestic product. Consumer spending is individuals and families purchasing groceries, clothing, recreation, stocks, insurance, education and much more. The transactions cover a broad swath of economic activity.

Much of the nation’s consumer spending is captured via retail trade. A useful retail trade definition is “the re-sale (sale without transformation) of new and used goods to the general public, for personal or household consumption or utilization.” Not all consumer spending is captured through retail trade transactions, but a large share is.

Broad-category examples of retail trade sectors are motor vehicle sales, furniture stores, electronic stores, building material stores, grocery stores, pharmacies, gas stations, clothing stores and department stores, among others. Then there is the relatively new and emerging part of the retail trade sphere—non-store retailers. These are establishments that sell products on the internet. Examples include Amazon, Zappos, Overstock.com, or eBay. These types of retailers have grown rapidly in the past 15 years and their presence is reshaping the retail trade landscape.

Whereas in the past nearly all retail transactions were done through traditional brick-and-mortar stores, now a significant and growing segment is diverted to internet sales. The consumer shops online and goods are delivered to the customer’s doorstep. One can see that the number of brick-and-mortar stores and the level of local sales across the country are being endangered by this economic evolution.

The brick-and-mortar reduction is beginning to show its economic presence in the United States employment numbers. While the U.S. economy is finally expanding at a healthy pace this side of the Great Recession, one of the few industries not rising with this tide is retail trade. While overall retail sales are increasing, employment is not. Traditionally, as a population increases, retail trade employment grows simultaneously, since population growth and consumer spending volume is an integrated dynamic. If studied deeply, a certain ratio of retail trade employment growth spawned from population growth would emerge. Before the internet, the vast majority of all consumer sales occurred in the immediate community or region. But now, the internet is diverting these sales away from the local community — and with internet sales growing, its market share will increase.

We do not yet know how much brick-and-mortar erosion will eventually occur. And will such a phenomenon hit some areas more than others (such as urban vs. rural; or local vs. tourist spending)? These are touch points that economist will be watching as this internet sales phenomenon continues to grow within the national and Utah economies.

In light of this change, in this quarter’s Local Insights we are profiling retail trade employment throughout Utah’s local regions. This can offer a profile of where retail trade is now in a local economy, and possibly how much of the sector could become vulnerable to the internet-sales phenomenon.

All regions can be viewed through the Local Insights web portal. The following is a retail trade profile for the Central Region:

Slow Going


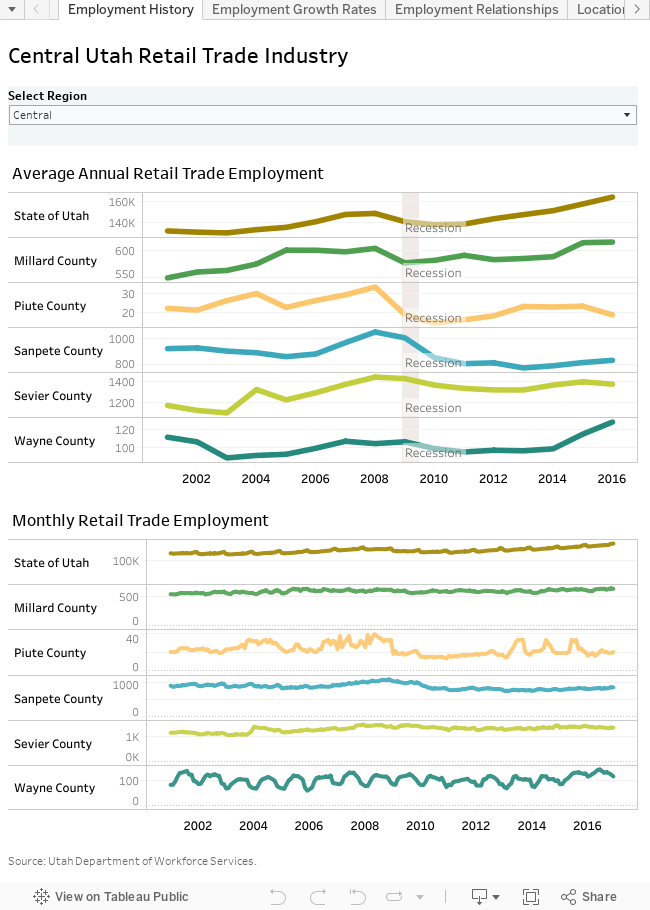
Just how important is retail trade employment in Central Utah? In 2016, roughly 3,000 Central Utah workers were employed in retail trade representing 14 percent of total nonfarm employment in the region. That’s somewhat higher than the statewide retail average of 12 percent. However, although retail trade employment has ebbed and flowed during boom, recession and recovery, the overall trend remains essentially flat. In fact, Central Utah has not yet regained the retail employment levels of the pre-recession boom. While lackluster population growth is probably the main factor in the sluggish retail sector, perhaps online buying plays a part as well.

Most Central Utah counties experienced strong retail trade employment growth in the booming mid-2000s. However, recession stole most of these gains and Central Utah has struggled to add retail employment even during the recovery. Wayne and Millard counties experienced some of the region’s best retail job expansion in recent years, but have yet to show consistent improvement. They are the only two counties to have regained their pre-recession employment levels. Sanpete County has seen steady improvement in the last three years, but growth rates remained moderate.
Tis the Season


Retail trade employment can be very seasonal in nature. In the Wayne County economy, a strong tourism and recreation component produces a significant seasonal pattern. Employment peaks in the summer months and bottoms out in January or February. Retail trade jobs almost double between trough and peak in Wayne County.

Seasonality is not as pronounced in the remaining Central Utah counties. The two most populated counties (Sanpete and Sevier) do show a moderate increase in retail jobs during the holiday season.

Dependency


Some counties in Central Utah are more dependent on retail trade employment than others. Statewide, retail trade employment accounts for about 12 percent of total nonfarm jobs. Sevier (16 percent), Millard (15 percent) and Wayne (13 percent) counties all show higher percentages of retail trade employment than the state. Sevier County attracts shoppers from outside the county boundaries. Millard County is relatively far away from more populous shopping areas, and Wayne County’s tourism appears to pump up its retail employment.

Location quotients (LQ) provide another way of looking at the importance of an industry. These ratios compare an area’s industry employment share to that of the nation. A retail trade LQ of 1 indicates the area’s industry employment makes up the same share of employment as that industry does nationwide. A location quotient greater than 1 means the area’s industry has a greater employment share than the United States. Utah’s retail trade location quotient measures just higher than 1. However, Sevier County has a retail trade LQ of nearly 1.5, signifying the distinct importance of retail employment in this county. Millard and Wayne counties also show notable retail trade LQs — both in the range of 1.2. On the other hand, Sanpete County (which is relatively close to Utah County shopping) shows an LQ of roughly 1.

In Sevier and Millard counties, the share of retail trade employment has remained fairly steady over time. However, in Sanpete County, the importance of retail trade jobs has steadily declined since the beginning of the recession. Wayne County’s retail trade industry has taken over a more important role in the labor market, partly due to a change in the industry mix when the county lost its largest employer several years back.

Relationships


Population per retail worker also provides insights into the retail trade industry’s local importance. Statewide, there are roughly 16 residents per retail trade job. With just under 15 inhabitants per retail sales worker, Sevier County is the only Central Utah county to register a lower number than the state. This lower-than-average figure arises because Sevier County acts as a regional shopping destination for many rural neighbors. With its sparse population, Piute County showed a whopping 78 residents per retail trade worker. Most of the population is apparently doing their primary shopping in nearby Sevier County. In Wayne County, the number of residents per retail job has dropped in recent years as retail employment showed strong gains.

Down to Subsectors


In Central Utah, food and beverage stores dominate subsector employment, accounting for almost 25 percent of retail trade jobs. Gasoline stations and general merchandise store (e.g., Wal-Mart) show the next largest employment portion with 18 percent each. Motor vehicle/parts dealers and building materials/garden dealers also account for 10 percent of more of the retail sales workforce.

The share of Central Utah employment at food and beverage stores (25 percent) measures almost double the statewide share (15 percent). Building/garden supplies dealers and gasoline stations also provide a significantly large retail employment portion in Central Utah than in the state as a whole. On the flip side, specialty stores (e.g., clothing, electronics, furniture, sporting goods) contribute much smaller shares of retail employment in Central Utah than statewide. Non-store retailer employment is also in short supply in Central Utah, suggesting the area’s labor force is not benefitting from online sales.

A Fair Share?


Since 2000, food/beverage stores, gasoline stations and motor vehicle/parts dealers have lost labor market share. In contrast, both general merchandise stores and building material and garden dealers have picked up the employment slack as big-box stores moved into the area.

Wages


Retail trade is not known for its excessive wages. In 2016, only leisure/hospitality services showed a lower average monthly wage in Central Utah. Not only are retail trade’s hourly wages lower than average, many jobs are part-time contributing to its lower-than-average standing.

Statewide, the average monthly wage for a retail trade worker measures less than $2,600. Not surprisingly, the average retail trade wage measured even lower in all Central Utah counties. Nevertheless, a wide disparity in wages exists even within the region. In shopping-hub Sevier County, the 2016 average monthly retail trade wage registered nearly $2,100, while in Piute County, the average was a mere $1,200.

The Same, but Different


Retail trade wages also show a notable variety in relationship to the average county wage. Statewide the retail trade industry wage measures 70 percent of average. In the two most populous Central Utah counties, Sanpete (74 percent) and Sevier (73 percent), retail trade wages compare more favorably to the overall county average than in smaller counties. In Wayne and Piute counties, the retail wage measures between 50 and 55 percent of average. Millard County’s figure measures, by far, the lowest at 46 percent. The presence of high-paying utilities jobs in Millard County pushes up the comparative average.

Although the gap between retail trade and total average wages widened statewide between 2001 and 2016, most Central Utah counties showed little change in the relationship between the two wages. This suggests that earnings in other industries are growing at about the same rate as those in retail trade. Piute was the lone exception. Here retail trade wages have improved relative to the average wage since the end of the recession.

Within the retail trade industry in Central Utah, the few jobs at non-store retailers showed the highest average wage followed by motor vehicles/dealers and electronics stores. On the low end of the scale, clothing stores paid the lowest wages.

Thursday, April 27, 2017

Census Bureau Tool Provides Labor-Force Insight for Utah


By Mark Knold and Lecia Langston

Across the United States, jobs are quantified through each state’s unemployment insurance program. Those programs provide the potential for laid-off workers to receive unemployment benefits — the goal being to bridge the gap between workers’ lost jobs and their next jobs. An eligible recipient’s weekly benefit amount is based upon their earnings from recent work. This begs the question, how does Utah’s unemployment insurance program know how much an individual recently earned while working?

That answer is supplied by all businesses that hire workers, as they must report their employees and pay as mandated by the unemployment insurance laws. Companies identify their individual workers and those workers’ monetary earnings for a calendar quarter. As businesses are identified by their industrial activity and geographic location, it is through the unemployment insurance program that aggregate employment counts by industry and location are calculated.

Yet each state’s profiling of individuals is quite minimal in the unemployment insurance program. The U.S. Census Bureau can bring more light to the overall labor force by supplementing said information with gender, age, race/ethnicity and educational attainment (imputted from American Community Survey responses) for Utah’s labor force.

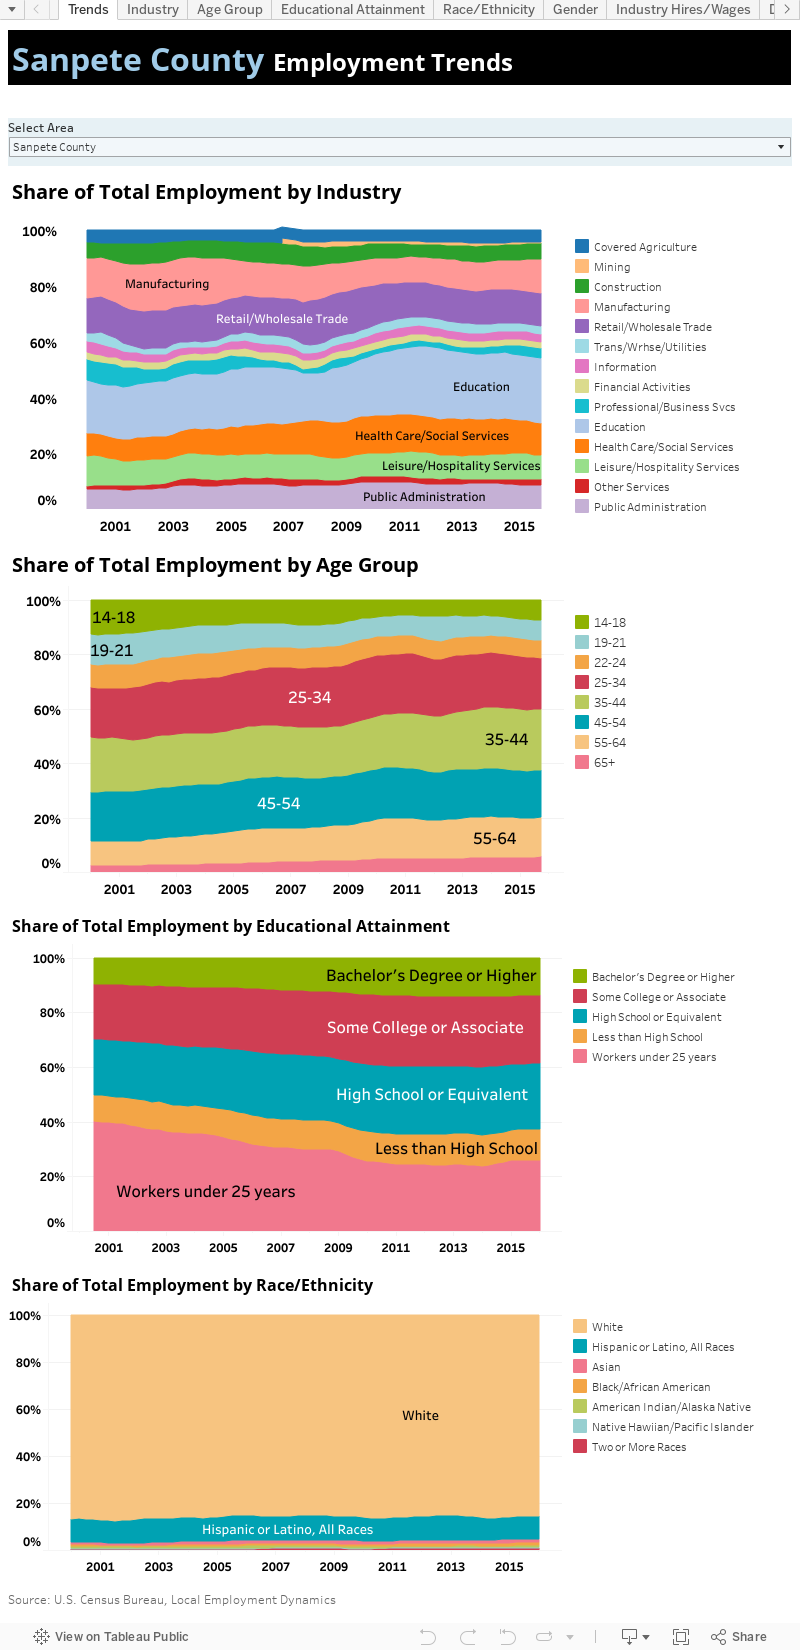
The Census Bureau packages this information through their Local Employment Dynamics program and makes available said data on its website. Here at the Department of Workforce Services, we recently downloaded and packaged Utah-specific data from said website and summarized it in the attached visualization.

Various data “tabs” are available, presenting Utah’s economy from different angles, ranging from industry shares within the economy to the age-group distributions of the labor force, to gender and race distributions. These labor variables can be viewed for the state as a whole, or by each individual county.


Tuesday, October 18, 2016

Wayne County Economic Update

As is often the case for less-populated counties, what goes up rapidly can just as rapidly come down. Wayne County’s skyrocketing nonfarm job growth rate (16 percent in January) has evaporated in just six months. Whether the county can revive its employment expansion before year end is yet to be seen. Despite a tumbling job growth rate, joblessness has returned to its recent slowly declining ways. Although the unemployment rate remains high, first-time claims activity remains low. Wayne County’s mixed bag of indicators is rounded out by strong performance in both construction-permitting and sales.


  • In total, between the second quarters of 2015 and 2016, Wayne County’s nonfarm jobs increased by almost 5 percent. 
  • Unfortunately, by quarter-end, the county was experiencing slight year-over employment contraction. 
  • On an industry level, retail trade’s job gains were canceled out by leisure/hospitality services’ job losses. 
  • Other industries showed minor changes in employment totals. 
  • After a brief lull, Wayne County's jobless rate continued on its slow three-year decline and is down nearly a full percentage point from last year. 
  • The county’s August 2016 unemployment rate of 7.9 percent reflects a seasonal, tourism-driven economy. 
  • First-time claims for unemployment insurance are currently following a seasonal pattern suggesting that no unusual layoff activity has occurred so far in 2016. 
  • The leisure/hospitality services industry has generated the lion’s share of new claims so far this year. 
  • The county’s average monthly nonfarm wage took a breather from its recent expansion. 
  • Between the second quarters of 2015 and 2016, the average wage was virtually unchanged. 
  • Wayne County’s notable increase in permitted construction values is being driven by several nonresidential projects. 
  • New home building is down slightly from last year. 
  • Gross taxable sales were up almost 5 percent when the second quarters of 2015 and 2016 are compared marking four straight quarters of sales gains. 
  • Retail trade and accommodations accounted for much of the second quarter improvement.

Sevier County Economic Update

Sevier County has backed off from the healthy job growth it experienced in2015. Nonfarm job totals seem to be treading water with only marginal improvement. Although some industries have made employment strides, others have shed jobs. Slower job growth coordinates with an uptick in unemployment during spring and early summer (which has since abated). First-time claims for unemployment insurance currently show no sign of unusual economic distress. On the other hand, a dip in gross taxable sales combines with slower job growth to suggest the economy could use some revitalization.

  • After a brief dip into negative territory in May, Sevier County’s June 2016 nonfarm jobs total edged up by a little more than 1 percent (up about 110 jobs). 
  • Healthcare/social services made the largest employment contributions with help from mining, construction and the public sector. 
  • However, trade, information, leisure/hospitality services and other services all took notable job hits. 
  • After a brief uptick between March and June, Sevier County's unemployment rate has slipped back down to more normal levels. 
  • Joblessness measured 4.3 percent in August 2016, slightly higher than the statewide average, but below the national rate. 
  • In the first ten months of 2016, first-time claims for unemployment insurance followed a traditional seasonal pattern with no signs of unusual stress. 
  • So far this year, construction, retail trade and private education/healthcare/social services have generated the most claims activity. 
  • The county’s average monthly wage continued to show some improvement. 
  • Between the second quarters of 2015 and 2016 Sevier County’s average monthly wage expanded by almost 3 percent. 
  • Gross taxable sales dipped slightly (down about 1 percentage point) between the second quarters of 2015 and 2016. 
  • Despite strong sales growth at building/garden stores and food stores, a decrease in business investment expenditures and car sales put a drag on the overall sales totals.

Sanpete County Economic Update

Sanpete County’s economic indicators have aligned to paint a bright picture for the economy. Nonfarm jobs continued a two-year streak of moderate-to-strong year-over gains. While joblessness edged up slightly between March and June as workers entered and reentered the labor market, unemployment had dropped back to early 2016 levels by August. The share of out-of-work individuals remains relatively low. First-time claims for unemployment insurance also are also nominal, while construction permitting is up dramatically. Sales rounded out this strong performance with a healthy second quarter gain.

  • Between June 2015 and June 2016, Sanpete County added more than 240 nonfarm jobs for a year-to-year growth rate of 3.2 percent. 
  • Employment expansion in government, construction, manufacturing, trade/transportation/utilities and professional/business services proved sufficient to overshadow a 60-job loss in leisure/hospitality services. 
  • Other major industries experienced minor employment improvement. 
  • Following Utah’s lead, Sanpete County’s unemployment rate increased somewhat in in spring and early summer only to slip back down by summer's end. 
  • At 4.0 percent in August 2016, joblessness remains relatively low from an historical perspective. 
  • During the first 10 months of 2016, new unemployment insurance claims followed the seasonal pattern of the past several years with no sign of cyclical layoffs. 
  • Due to its project-to-project nature, construction accounted for a large share of current 2016 claims activity. 
  • Average monthly wages continued to trend upward. The county’s second quarter 2016 year-to-year gain of more than 4 percent appeared particularly encouraging. 
  • Construction permitting for the first eight months of 2016 is up substantially from the same time period in 2015. 
  • Both new residential and new nonresidential permit values contributed to the overall increase. 
  • Gross taxable sales turned in a strong second quarter 2016 gain as sales increased nearly 5 percent over second quarter 2015 figures. 
  • Sales at retail establishments registered particularly robust increases. 
  • The only decline of note was contraction in manufacturing business investment expenditures.

Piute County Economic Update

Piute County’s in-county labor market continued to struggle in the second quarter of 2016. A meager one-job gain in June was hardly sufficient to counteract job losses earlier in the quarter. Despite a rather disheartening jobs picture, unemployment slipped back down after a significant spring and early summer increase. The improvement in joblessness despite the lack of new jobs suggests workers have found employment outside the county or left the labor market all together. Moreover, the county’s jobless rate registers notably higher than the state average. While a slight uptick in sales sheds a little light on this rather gray picture, it falls far short of suggesting the county’s economy is back on track.

  • Piute County managed to stave off job loss in just one month of second quarter 2016. Moreover, the June 2016 year-over gain was merely one nonfarm job. 
  • In the last 12 months, job gains in professional/business services and leisure/hospitality services just offset job losses in government and retail trade. 
  • As in many Utah counties, Piute County joblessness bumped up a notch in spring and early summer only to edge back down, but remains relatively high. 
  • In August 2016, the unemployment rate estimate for Piute County measured 6.0 percent, more than 2 percentage points higher than the statewide average (3.7 percent). 
  • Yet, new unemployment insurance claims remain low with most claims so far this year originating in construction. 
  • The county’s average monthly wage continued to eke out gains as the year progressed. Second-quarter’s year-over gain of nearly 5 percent kept wages in 2016 trending upward. 
  • Piute County’s gross taxable sales managed modest gains. Between the second quarters o 2015 and 2016, sales increased by almost 3 percent. 
  • A notable decrease in food/beverage store sales contributed to a decline in overall retail sales. 
  • Interestingly, private motor vehicle sales generated the largest sales-dollar increase during the quarter.

Millard County Economic Update

Millard County’s labor market rallied from a lackluster performance earlier in the year with notable improvement throughout the second quarter of 2016. While the public sector provided much of the job increases, most industries added workers and the few job losses proved minor. After an unseasonal summer increase in first-time claims for unemployment insurance, the county experienced an uptick in joblessness. However, by September unemployment had retreated to its previously low level. In addition, strong nonresidential permitting has kept new building values on the high side. While sales growth proved rather lukewarm, in general, Millard County’s economic indicators provide an upbeat portrait of the area’s economy.

  • Millard County’s nonfarm jobs bounced back in the second quarter of 2016. Between June 2015 and June 2016, the county added nearly 150 new jobs for a strong 3.5 percent growth rate.
  • Much of the improvement occurred in the public sector. However, construction also managed hearty job gains. 
  •  Professional/business services, private education/healthcare/social services and leisure/hospitality services also contributed to the overall expansion with less flashy gains. 
  • Relatively minor job losses in wholesale trade and information counterbalanced only a small portion of job gains. 
  • After a slight spring and early summer uptick, Millard County's jobless rate returned to the lower rates of early 2016. 
  • At 3.4 percent, unemployment remains very low in August 2016. 
  • First-time claims for unemployment insurance took an unseasonal spike in late spring and summer but had settled back to a more normal pattern by mid-September. 
  • The construction industry contributed the largest number of new claims so far in 2016. Average wages continued to improve as the year progressed. 
  • The average wage for second quarter 2015 showed a healthy 4-percent gain over the same figure for second quarter 2016. 
  • New nonresidential permitting took the lead in the vast improvement in construction permitting values for the first eight months of 2016. 
  • Solar farm permitting as well as permits for several retail buildings contributed to the strong gain in authorized values. 
  • Gross taxable sales improved by a rather lackluster 2.2 percent between the second quarters of 2015 and 2016. 
  • A notable decline in manufacturing business investment expenditures kept a lid on overall sales. 
  • On the flip side, expenditures mining counteracted part of the manufacturing decrease. In addition,sales at retail establishments showed gains.

Tuesday, August 2, 2016

Wayne County Economic Update

Wayne County’s labor market shot up dramatically in the first few months of 2016. First quarter 2016 marks more than a year’s worth of nonfarm job growth. While the expansion rates have proved erratic, this vacillating behavior is common among small counties. Not only is the employment base expanding, but most industries sported membership in the job-creation club. Joblessness seems to have stalled at a relatively high level, not uncommon to tourism-driven economies. Although the unemployment rate remains high, first-time claims activity remains low suggesting layoffs are not playing a present-day role. Early 2016 growth in both construction and sales also points towards an improving economy.

  • Wayne County’s nonfarm employment showed expansion between March 2015 and March 2016 with almost 90 new jobs and a year-over growth rate of nearly 11 percent. 
  • Retail trade and leisure/hospitality services added the largest numbers of new employment, ranking first and second in employment creation. 
  • Government, construction and healthcare/social services also contributed to the new job totals. 
  • Industry-level job losses were virtually nonexistent. 
  • After edging down for the better part of two years, Wayne County’s jobless rate seems to have stalled. 
  • The county’s June 2016 unemployment rate of 8.4 percent reflects a seasonal, tourism-driven economy. 
  • First-time claims for unemployment insurance are currently following a seasonal pattern suggesting that no unusual layoff activity has occurred so far in 2016. 
  • The leisure/hospitality services industry has generated the lion’s share of new claims so far this year. 
  • The county’s average monthly wage has slowly edged upwards in fits and starts. 
  • The first quarter 2016 wage took a breather from the ascending trend displaying virtually no change since first quarter 2015. 
  • Construction permitting was off to a rapid-fire 2016 start with the authorization of several large nonresidential projects. In the first three months of 2016, residential permitting ran slower than in the same time period in 2015. 
  • Gross taxable sales increased at a robust 12-percent rate between the first quarters of 2015 and 2016. 
  • Accommodations, food services and general merchandise stores showed the highest sales gains.

Sevier County Economic Update

After a strong end-of-year performance, Sevier County’s economy stepped back a notch in the first few months of 2016. The county continued to create new employment, but the rate of employment proved notably slower than just a quarter earlier. Nevertheless, the area hasn’t experienced employment contraction since 2013. As job growth waned, unemployment edged up. Although joblessness has risen slightly, it remains relatively low and first-time claims for unemployment insurance are running at a seasonal level. Following employment’s lead, gross taxable sales expanded but at a rather tepid rate. In general, the economy is improving, but at a lukewarm rather than scorching speed.


  • Nonfarm jobs in Sevier County grew by 1.2 percent between the March 2015 and March 2016, reflecting the addition of about 100 jobs. 
  • Healthcare/social services made the largest employment contribution followed by construction and government. 
  • While several industries contracted, the only job loss of note occurred in the tourism-driven leisure/hospitality services industry. 
  • Sevier County’s unemployment rate has increased 0.6 percentage points since the beginning of the year. 
  • Joblessness measured 4.8 percent in June 2016, below the statewide average and roughly equal to the national figure. 
  • In the first half of 2016, first-time claims for unemployment insurance followed a traditional seasonal pattern with no signs of unusual stress. 
  • So far this year, construction, retail trade and private education/healthcare/social services have generated the most claims activity. 
  • Despite decelerating job growth, Sevier County’s average monthly nonfarm wage continues to trend upward. 
  • Between the first quarters of 2015 and 2016, the average wage increased by more than 3 percent. 
  • Current construction data is not available for Sevier County. 
  • Gross taxable sales increased by a lackluster 1.4 percent between the first quarters of 2015 and 2016. 
  • General merchandise stores showed the strongest sales improvement. In addition, business investment expenditures rose nicely. 
  • On the downside, wholesale trade sales dipped noticeably.
  • Sanpete County Economic Update

    Sanpete County rang in the new year with another quarter of strong economic growth. Nonfarm jobs showed solid gains and broad-based expansion. In contrast, joblessness has edged up in recent months. Strong employment expansion coupled with a dearth of unseasonal unemployment insurance claims activity suggests the rise is the result of workers entering and re-entering the labor market. Gross taxable sales expanded nicely falling in line with employment growth. Despite the recent uptick in unemployment, most indicators illustrate a healthy Sanpete County economy.


  • Between March 2015 and March 2016, Sanpete County added more than 280 new nonfarm jobs for a year-over growth rate of nearly 4 percent. 
  • Manufacturing produced the largest number of new jobs with healthcare/social services, retail trade and professional/business services contributing notable numbers of new positions. 
  • The only significant job loss occurred in leisure/hospitality services. Following Utah’s lead, Sanpete County’s unemployment rate has increased in recent months. 
  • However, at 4.4 percent in June 2016, joblessness remains relatively low from an historical perspective. 
  • During the first half of 2016, new unemployment insurance claims followed the seasonal pattern of the past several years with no sign of cyclical layoffs. 
  • Thanks to its project-to-project nature, construction accounted for a large share of current 2016 claims activity. Sanpete County’s average monthly nonfarm wage continues to slowly improve. 
  • However, the year-to-year increase for first quarter 2016 proved lower than usual – less than 1 percent. 
  • Current construction data is not available for Sanpete County. Gross taxable sales showed a strong 8.5 percent increase between the first quarters of 2015 and 2016. 
  • Prior-period adjustments and business investment expenditures accounted for much of the addition although food/beverage stores, general merchandise stores and private motor vehicle sales all made solid showings.
  • Piute County Economic Update

    Piute County’s economic indicators portrayed another difficult quarter. Nonfarm jobs took another hit in first quarter 2016 and not surprisingly, unemployment trended upward. Fortunately, given the local employment contraction, many workers have found employment outside the county’s boundaries. A decline in gross taxable sales rounded out this rather disappointing beginning to 2016.


  • Piute County showed a 9-job, 4-percent year-over decline in nonfarm employment for March 2016. 
  • Job losses in leisure/hospitality services accounted for much of the decline with no major industry producing a noteworthy employment increase.
  • After declining for most of 2015, Piute County’s unemployment rate is once again on the rise. 
  • In June 2016, the unemployment rate estimate for Piute County measured 6.8 percent, almost 3 percentage points higher than the statewide average (4.0 percent). 
  • Yet, new unemployment insurance claims remain low with most claims so far this year originating in construction. 
  • The county’s average monthly nonfarm wage continued to edge upward despite employment shrinkage. 
  • In fact, between the first quarters of 2015 and 2016, the average wage increased by 8 percent. 
  • Current construction data is not available for Piute County. 
  • Between the first quarters of 2015 and 2016, Piute County’s gross taxable sales dropped by roughly 2 percent. 
  • Most retail sectors experienced declining sales.
  • Millard County Economic Update

    After a strong 2015 ending, Millard County’s employment picture clouded at the beginning of 2016. In first quarter 2016, nonfarm employment showed little change from comparable totals for the previous year. On an industry level, performances roamed all over the map with some industries experiencing strong expansion and other industries contracting. With this spotty employment experience and an unseasonal increase in first-time claims for unemployment insurance, the current uptick in joblessness is only to be expected. On the plus side, thanks to solar farm permitting, construction values improved substantially in first quarter. And while much of the reported gross taxable sales gain resulted from a prior-period adjustment, current sales increased nicely as well. Slow job growth and variability in the other recent indicators suggests the economy shows room for improvement.

  • In the 12 months prior to March 2016, Millard County created only 13 new positions for a year-to-year change of 0.3 percent. 
  • Strong employment gains in construction, professional/business services and private educational services were basically offset by employment contraction in retail trade, information and leisure/hospitality services. 
  • An additional 23 covered agricultural jobs are not included in the nonfarm totals. 
  • Slower job growth coupled with construction layoffs in late spring to nudge Millard County’s unemployment rate up to 3.7 percent in June 2016. 
  • However, the county’s jobless rate remains relatively low. 
  • First-time claims for unemployment insurance took an unseasonal spike in late spring/early summer. 
  • The construction industry contributed the largest number of new claims so far in 2016. 
  • Millard County’s average monthly nonfarm wage continues to trudge upwards. 
  • Between the first quarters of 2015 and 2016, the average wage increased by a healthy 4 percent. 
  • With little construction permitting data available so for this year, new nonresidential permits are dominating figures. 
  • Permitting for the solar farm can claim primary credit for the current high figures. 
  • The reported 49-percent increase in first quarter 2016 gross taxable sales shrinks to only 10 percent when prior-period adjustments are removed. 
  • Of course, 10-percent expansion is still certainly robust. 
  • Much of the current gain can be traced to increased business investment expenditures.
  • Thursday, July 28, 2016

    The Infrastructure Labor Market

    By Mark Knold, Supervising Economist, and Lecia Parks Langston, Senior Economist

    The labor force is made up of people. People vary in every conceivable way. One person is artistic while another can only draw stick people. One person might be able to disassemble and reassemble a car engine while another might not know what an alternator is. We are different. We have different aptitudes and abilities.

    Parallel to this variability, jobs are different. High levels of education do make it possible to work in high-skill occupations that return high incomes. But not everyone is cut out for higher education or has the means to obtain higher education. Therefore, they might end up in “lesser” or “unimportant” jobs.

    But is that accurate? Are their job options inferior and unimportant? A recent Brookings Institution report brings to light a segment of the economy that is highly important yet is dependent upon the labor force that may not be built for, have the economic means, or desire to attain a college degree or higher.


    Brookings identifies a niche they call the infrastructure economy. As Brookings notes, “Infrastructure helps facilitate the exchange of information, drive production, and deliver resources, spanning multiple sectors of the economy and serving as a foundation to long-term growth.” It goes further to note that “Infrastructure jobs depend on a steady stream of talent to construct, operate, design, and govern the country’s major physical assets.”

    Brookings also documents why these infrastructure jobs can appeal to the individual. “Infrastructure occupations also boast competitive wages with relatively low barriers to entry, frequently paying up to 30 percent more to workers with a high school diploma or less compared to those in all other occupations. Plumbers, truck mechanics, and power line installers are among the numerous infrastructure occupations that fall into this category, which tend to emphasize on-the-job training rather than higher levels of formal education.”

    Brookings identified 95 occupations that support the infrastructure foundation. Their work was well founded and designed. This intrigued us to develop a profile of said infrastructure configuration for the Utah economy. We could not replicate the Brookings work in terms of finalizing upon infrastructure industries, but we could place our focus instead upon all infrastructure occupations.

    Infrastructure occupations do not have to be found in only infrastructure industries. A helicopter pilot, an infrastructure occupation, may fly a medical helicopter for a hospital, even though said hospital is not categorized as an infrastructure industry.

    What is important is that there are occupations that Brookings has identified as key occupations that help to keep the economy operating, growing, designed, and governed. And a practical appeal is that many of these jobs offer low barriers to entry while supplying competitive wages.

    Across the nation, these occupations number 11.9 million, or 8.8 percent of all occupational employment. In Utah, these jobs number around 121,400, also 8.8 percent of all occupational employment. Again, the appeal of these jobs is not just that they fundamentally support so many other jobs and industries in the economy, but that these jobs don’t require a high level of education or formalized training for entry. Oftentimes these occupations emphasize only on-the-job training. Yet, these jobs pay on average 22 percent higher in Utah than other occupations that are willing to accept only a high school diploma or less.

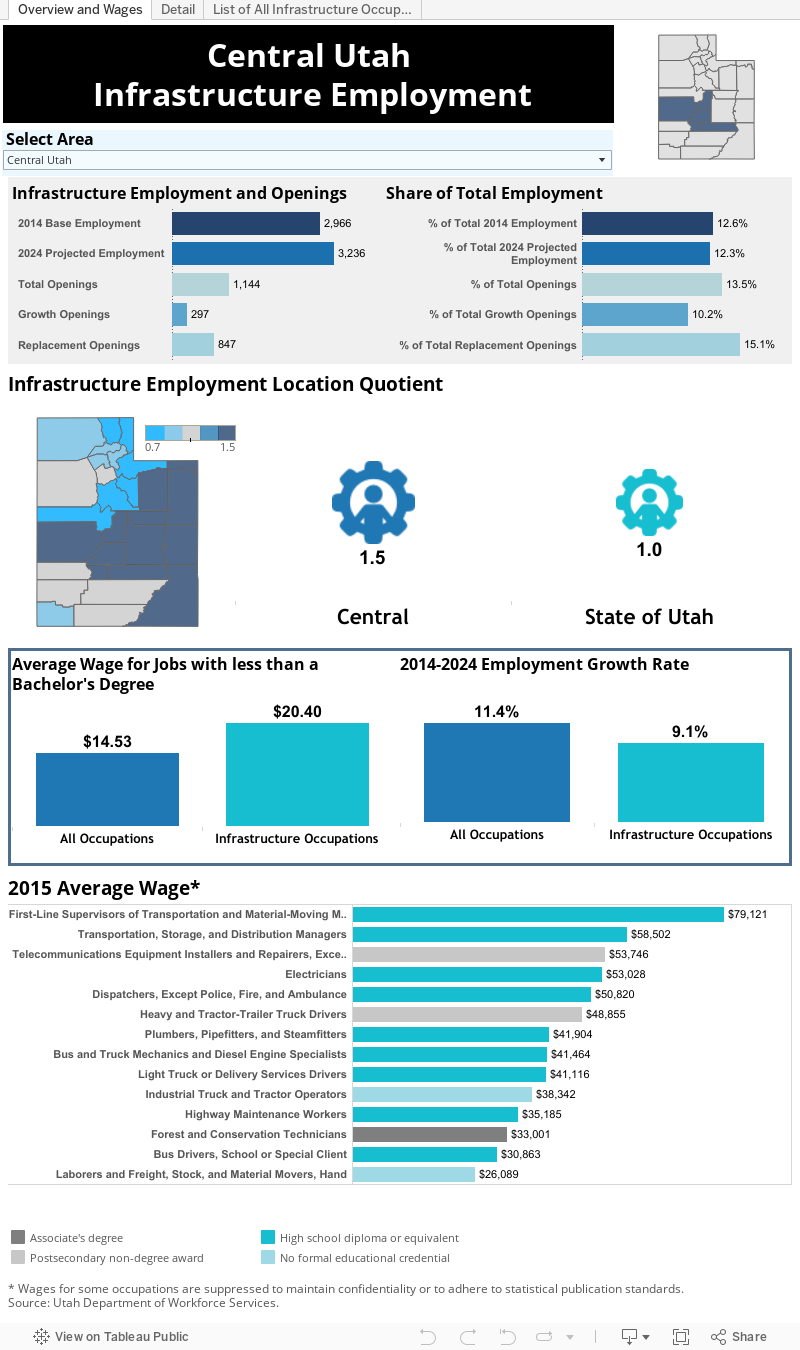
    Utah does have its unique structuring across its different geographic regions, and this will include the possibility of a different profile of the infrastructure economy in each local region. The following is an infrastructure profile for the Central Utah region.

    Central Utah 

    Infrastructure jobs play a major role in the Central Utah economy providing better wages than other positions requiring similar education and training. 

    Central Utah (Millard, Piute, Sanpete, Sevier and Wayne counties) is home to roughly 3,000 infrastructure jobs, a striking 13 percent of total employment. With this high share of employment, the area’s infrastructure location quotient is 1.4 compared to 1.0 statewide. Location quotients quantify the regional concentration of this occupational group compared to the nation. In this case, Central Utah infrastructure employment accounts for a share 40 percent greater than the national average. A large number of heavy/tractor-trailer drivers in the area are largely responsible for Central Utah’s high infrastructure location quotient.

    Pay 

    In Central Utah, infrastructure jobs requiring less than a Bachelor’s degree pay roughly 40 percent more than similar jobs in the overall Central Utah economy. Many of the highest-paying infrastructure occupations require just a high school education (plus on-the-job training).

    Education and Training 

    About 97 percent of Central Utah’s infrastructure jobs typically require less than a Bachelor’s degree. The major role played by heavy/tractor-trailer drivers in the region contributes to the large share of infrastructure jobs with a post-secondary non-degree award (40 percent). Most infrastructure jobs require little on-the-job training. More than three-fourths of the jobs are in occupations calling for on-the-job training of a month or less.

    Again, a preponderance of heavy truck driver employment dominates the activities of the area’s infrastructure employment. Almost 80 percent of infrastructure employment is involved in operating activities. Construction-related activities account for the next largest share at 12 percent.

    Looking Forward 

    Over the next decade, infrastructure employment in Central Utah is projected to grow at a slightly slower rate (9 percent) than overall employment (11 percent). However, there is a significant need for replacements in this occupational group. While infrastructure jobs are expected to account for roughly 10 percent of openings due to growth, they should generate 15 percent of replacement openings.

    Thursday, April 21, 2016

    Your area’s labor market information is “OnTheMap”

    The Census Bureau’s online mapping tool provides a wealth of location-specific labor market information 

     By Lecia Parks Langston, Senior Economist 

    “If you want to put yourself on the map, publish your own map.” Ashleigh Brilliant 

    This isn’t your same old blog post about data. Instead of analyzing and sharing data, this post covers how to access an extremely useful “big data” labor market information tool. What is this tool? The U.S. Census Bureau’s OnTheMap web-based mapping and reporting application. http://onthemap.ces.census.gov/

    What’s so great about OnTheMap? Typically, we report labor market information at the state and county level. Local-level data is harder to come by. Along with the ability to provide labor market profiles of small and large nonstandard areas, OnTheMap graphically demonstrates where people work and where workers live. Users can define their own geographies and obtain data and maps at the census-block level of detail. This flexibility can quickly provide information for emergency and transportation planning, site location and economic development.

    Do you want to understand commuting patterns for a particular area? OnTheMap can generate maps of outflow and inflow. Do you want to know the basic characteristics of workers in your town? OnTheMap has that information. Do you want to identify the employment characteristics along a specific stretch of highway? OnTheMap can deliver that data. Do you want to discern how many workers live within a 50-mile radius of a particular site? OnTheMap delivers.

    Where does this data come from? OnTheMap combines federal and state administrative data on workers and employees with Census Bureau census and survey data. Don’t worry. Using state-of-the-art methods, the Census Bureau is committed to protecting the confidentiality of business and personal information.

    Where People Work 

    Let’s run through a few examples of how OnTheMap outputs can help you understand your local economy. Suppose the Ephraim City Council wants to know where the residents of their town work. OnTheMap indicates roughly 40 percent of the city’s working residents are employed in Ephraim itself (zip code 84627). Not surprisingly, other high concentrations of Ephraim workers are in nearby towns. Interestingly, 28 percent of Ephraim workers commute to the Wasatch Front (Salt Lake, Utah and Davis counties) for employment.


    Next, the Mayor wants to know how many workers travel into Ephraim for employment. OnTheMap suggests that roughly equal numbers are entering and exiting Ephraim for employment purposes. In-commuters are most likely to drive from Manti.


     Labor Market Characteristics 

    Now, these local government officials have decided they would like to know the characteristics of those folks that work or live in Ephraim. OnTheMap can provide age-group, earnings, industry, race/ethnicity, gender and educational attainment information. For example, OnTheMap shows the following characteristics for working residents of Ephraim:

    • 27 percent are 29 years or younger
    • 29 percent make more than $3,333 a month
    • 23 percent work in education, healthcare or social services
    • 8 percent are Latino
    • 18 percent have at least a Bachelor’s degree
    • 46 percent are female

    Getting Specific 

    A company thinking of locating to Ephraim is interested in the number (and characteristics) of workers within a standard commuting distance of a particular worksite. Economic development professionals can specify a particular radius and obtain a report. Other shapes (donut and plume) are also available. In addition, users can draw their own polygons in OnTheMap. To determine how many workers may be inconvenienced by a road construction project, just draw a line along the length of the project and “buffer” the selection.


    You should begin to see what a valuable informational tool OnTheMap can be for planning and economic development purposes. OnTheMap is available here.

    Wednesday, April 20, 2016

    Millard County Economic Update

    Although Millard County briefly flirted with job loss at midyear, its employment has expanded moderately for most of 2015. In fact, fourth quarter turned in the strongest growth numbers of the year. Relatively steady employment expansion coupled with a persistently low jobless rate suggests the labor market is creating enough positions for new entrants. The trend in first-time claims for unemployment insurance also points to a balanced labor market free of cyclical distress. A strong showing in construction also points to a stable, yet growing Millard Count economy. The only somewhat sour note in this basically sweet story was a decline in gross taxable sales.


    • Between December 2014 and December 2015, Millard County added 100 new jobs for an expansion rate of 2.5 percent.

    • Although not particularly exciting, in this case, slow and steady employment growth may just win the race with broad-based expansion.

    • No major industry lost employment. However, wholesale trade, professional/business services and leisure/hospitality services contributed the highest number of new jobs.

    • Millard County’s unemployment rate has been hanging out just above the 3-percent mark for more than a year.

    • In March 2016, the county’s jobless rate measured 3.3 percent, below the statewide average of 3.5 percent. • New unemployment insurance claims are being filed at a level common to the seasonal pattern of the last three years, with no signs of major layoffs.

    • The seasonal construction industry contributed the largest number of new claims so far in 2016.

    • Millard County’s average monthly nonfarm wage continues to edge upward. Between the fourth quarters of 2014 and 2015, the average wage increased by a healthy 4 percent.

    • Construction permitting ended 2015 on a high note with a 40-percent annual increase in permitting values. • Permitting for industrial buildings drove up new nonresidential values.

    • Home permits reached the highest level since before the recession.

    • While gross taxable sales showed a substantial 19-percent loss between the fourth quarters of 2014 and 2015, most of the decline can be traced to prior-period adjustments.

     • Without the prior-period adjustments, sales showed only slight slippage.

    • Motor vehicle sales proved particularly strong in contrast the notable year-to-year decline in business investment expenditures.

    Piute County Economic Update

    Since the end of the national recession, growth in nonfarm jobs has been a rare occurrence in Piute County. Unfortunately, fourth quarter 2015 kept to the job-loss side of the fence. While many Piute County residents work outside the county, unemployment remains stubbornly high. On the other hand, first-time claims for unemployment insurance are following a noncyclical, seasonal pattern. Plus, gross taxable sales improved nicely in the fourth quarter of 2015. Despite some positives, Piute County’s economy continues to struggle.

    • Between December 2014 and December 2015, Piute County’s nonfarm job totals dropped 9.2 percent reflecting 22 lost jobs.

    • Job losses touched almost every major industry.

    • Leisure/hospitality services and government were responsible for most of the employment contraction.

    • Joblessness has decreased somewhat during the past year.

    • The county’s unemployment rate measured 5.9 percent in March 2016, down almost a full percentage point from March 2015.

    • Piute County unemployment rate can decline in the midst of job losses because many workers travel outside the county for employment.

    • New unemployment insurance claims remain low with most claims so far this year originating in construction.

    • The county’s average monthly nonfarm wage continued to edge upward despite employment shrinkage. In fact, between the fourth quarters of 2014 and 2015, the average wage increased by 11 percent.

    • In fourth quarter 2015, gross taxable sales grew (year-over-year) by 9.8 percent. Unfortunately, most of the gain resulted from prior period adjustments.

    • Gasoline stations showed some of the strongest gains.

    Sanpete County Economic Update

    Sanpete County finished 2015 with continued strong employment expansion. Job growth remains moderate and fairly broad-based while unemployment continues to hover in the full-employment range. New claims for unemployment insurance are following a seasonal, noncyclical pattern. Construction also showed improvement in 2015. On the other hand, gross taxable sales did experience a slight decline, but at the root of the decrease lay volatile business-investment expenditures rather than consumer spending. Overall, the economy appears hale and hearty.

    • Between December 2014 and December 2015, Sanpete County’s nonfarm jobs grew by 3.5 percent, adding almost 270 new positions.

    • While most industries did display job increases, leisure and hospitality services sustained a notable employment hit.

    • Manufacturing created the largest number of industry-level jobs with construction, retail trade and professional/business services following close behind.

    • At 4.0 percent in March 2016, Sanpete County’s jobless rate remained low and certainly in the full-employment range.

    • Jobless rates are currently running at the lowest levels since the end of the recession.

    • During the first few months of 2016, new unemployment insurance claims followed the seasonal pattern of the past several years with no sign of cyclical layoffs.

    • Thanks to its project-to-project nature, construction accounted for a large share of current 2016 claims activity.

    • As in most Utah counties, Sanpete County’s average monthly nonfarm wage continues to slowly improve. The year-to-year fourth quarter increase proved particularly strong at 5 percent.

    • Construction permitting data suggest Sanpete County’s building environment improved dramatically during 2015.

    • The number of new home permits rose in 2015 compared to 2014, but remains low from an historical perspective.

    • Gross taxable sales did slipped by 2.3 percent between the fourth quarters of 2014 and 2015.

    • The primary reason for the dip was a year-to-year decrease in business investment expenditures in the manufacturing industry.

    • On the consumer side, retail sales were up with strong gains at building materials/garden stores and general merchandise stores.

    Sevier County Economic Update

    Sevier County ended 2015 with its best employment performance of the post-recession era. Job growth in the final quarter of the year remained moderate with most industries contributing to the improvement. The county’s unemployment rate has flattened in the last two years holding below the national average while first-time claims for unemployment insurance show no signs of business-cycle layoffs. In addition, construction permit values are up. While gross taxable sales appear to have taken a tumble, business investment expenditures accounted for most of the decline. All in all, the county’s indicators point to the healthiest economy in years.

    • Nonfarm jobs in Sevier County grew by 2.5 percent between the December 2014 and December 2015, an addition of more than 200 jobs.

    • Most industries joined in the job growth phenomenon with the largest gains occurring in healthcare/social services and leisure/hospitality services.

    • In contrast, both trade and local government lost a notable number of positions.

    • Sevier County’s jobless rate has changed little over the past two years.

    • In March 2016, the county’s unemployment rate measured 4.3 percent, nestled between the national (5.0 percent) and the statewide (3.5 percent) figures.

    • The area’s relatively stable jobless rate suggests the labor market is expanding sufficiently to absorb new labor force entrants.

    • In the first few months of the year, first-time claims for unemployment insurance followed a traditional seasonal pattern with no signs of unusual stress.

    • So far this year, construction, retail trade and professional/business services (all with temporary or seasonal components) have generated the most claims activity.

    • As in most Utah counties, Sevier County’s average monthly nonfarm wage continues to trend upward. Between the fourth quarters of 2014 and 2015 the average wage increased by nearly 5 percent.

    • Construction permitting increased nicely in 2015 showing a 14 percent uptick.

    • Both new residential and nonresidential permitting improved.

    • Gross taxable sales experienced a year-to-year loss of 15 percent in the fourth quarter of 2015.

    • The change resulted primarily from a decline in manufacturing business investment expenditures rather than in traditional sales.

    • Motor vehicle dealers, building supplies/gardening stores, general merchandise stores, and food services showed particularly strong gains.

    Wayne County Economic Update

    As 2015 came to a close, Wayne County managed to hold on to the hard-won employment expansion of previous quarters. However, significant losses in several industries suggest the county’s job situation could still stand improvement. Unemployment remains high although it is trending downward. Construction permitting values increased in 2015 with the home-building market posting its best year since the recession. Finally, gross taxable sales made strong gains. While not completely healed from the loss of its largest employer several years ago, Wayne County’s economy is certainly moving forward.

    • Overall, Wayne County’s job growth proved relatively tepid with a 2.2 percent, 19-job gain between December 2014 and December 2015.

    • Employment expansion was hampered by significant declines in leisure/hospitality services and healthcare/social services.

    • On the positive side, mining, construction and retail trade grew sufficiently to more than offset losses in other industries.

    • Joblessness continued to improve in Wayne County.

    • The county’s unemployment rate has dropped more than a full percentage point over the past year.

    • Unfortunately, at 8.1 percent, the county’s jobless rate is the fifth-highest in the state and measures far above the statewide figure of 3.5 percent.

    • First-time claims for unemployment insurance are currently following a seasonal pattern suggesting that no unusual layoff activity has occurred so far in 2016.

    • The leisure/hospitality services industry has generated the lion’s share of new claims so far this year.

    • Although the county’s average monthly wage had flattened earlier in the year, it managed a strong 8-percent wage gain between the fourth quarters of 2014 and 2015.

    • In 2015, total construction permitting values increased by a robust 26 percent.

    • Wayne County authorized more new home permits in 2015 than in any year since the recession.

    • New nonresidential permitting remained essentially flat.

    • Between the fourth quarters of 2014 and 2015, Wayne County’s gross taxable sales displayed a healthy 15-percent increase.

    • Tourism-driven accommodations and food services industries experienced especially solid improvements as did food stores, general merchandise stores and gasoline stations.

    Monday, August 3, 2015

    Local Insights updated on the web

    By Mark Knold, Supervising Economist 

    Shelter is one of humanity’s basic needs. That is why housing is everywhere. Since housing is so ubiquitous, it becomes an important component in an economy’s foundation, and as such becomes an economic indicator.

    In this issue of Local Insights, we look at the demand for housing structures, the amount of housing permits and their history, and how this history shows that housing demand follows the ups and downs of a region’s economic performance. In evaluating the volume of housing permits, we also parallel the health and vitality of the local economy.

    People need jobs that supply them income in order to afford housing. Jobs are not the only factor, as things like affordability and the ability to obtain lending also play their part in housing demand. But the foundation of housing demand is the health of the job market.


    The graph shows Utah statewide housing permits. A trend of normal permitting activity is evident from 1996 through 2004. Permits rose during the pre-Great Recession boom, then became lethargic for the seven years following. It is just recently that the volume of permit activity is again approaching something normal. That in itself is an economic indicator of an improved Utah economy.


    --------------------------------------------

    To read more, see the latest issues of Local Insights. To receive a printed copy, please call 801-526-9785.