U.S. Census Bureau releases new 2018 Small Area Health Insurance Estimates
By Lecia Parks Langston, Senior Economist

Small Area Estimates
The SAHIE estimates cover the population under 65 years of age. Of course, virtually all citizens 65 and older are covered by government-provided Medicare benefits. Because these estimates date back to 2008, two years before the signing of the Affordable Care Act (ACA), they suggest the how the ACA has changed the health-insurance landscape in Utah.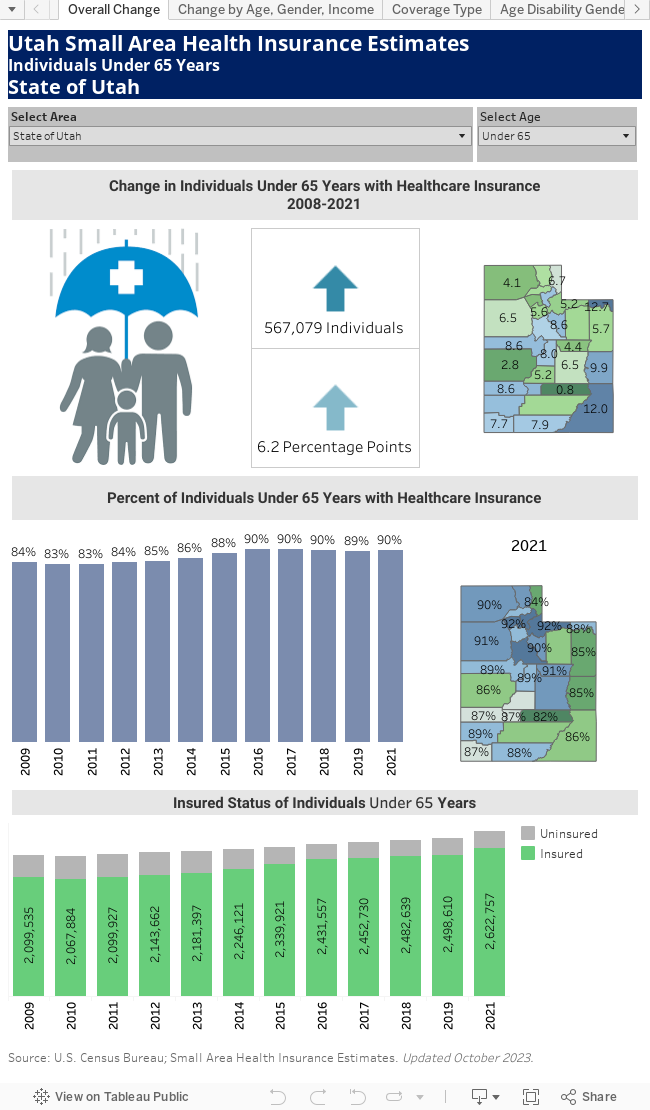
That was then, this is now
The number and share of Utahns covered by health insurance have certainly improved in the past 10 years. In 2008, roughly 83.7% of the under-65 population was insured compared to about 89.6% in 2018, an increase of nearly 6 percentage points. In terms of individuals, that increase represents a gain of 427,000 insured Utahns.
Less-populated counties, with initial low insured rates, experienced the strongest gains in insured shares. Daggett, Rich, Grand, Kane and San Juan counties displayed gains of roughly 10-points or higher. While all counties showed an improvement in the insured share of the under-65-year population, Salt Lake, Carbon, Summit and Millard counties experienced the smallest gains.
Highlights from the American Community Survey (2014-2018)
- Roughly 58% of Utahns (of all ages) are insured in full or in part by employer-provided plans. Only 9% directly purchase their entire insurance coverage from a private provider. In total, nearly 70% of the state’s citizens have private coverage.
- In total, public plans (Medicare and Medicaid) cover roughly 12% of Utah’s population. About 7% of the population is covered by Medicaid with another 3% covered by just Medicare. Roughly 1% of Utahns have coverage under both Medicare and Medicaid.
- Those with a combination of public and private coverage account for another 9% of Utah’s population. That group includes 4% of Utahns who carry Medicare plus a supplemental source of private insurance. On the other hand, 10% have no healthcare insurance at all.
- The very young and the very old are most likely to carry health insurance. Thanks to Medicare, individuals 65 years and older are the most likely to be covered (99%). On the other end of the spectrum, children under 6 years old displayed a coverage rate of 94%, with 6-18 year olds not far behind (92%).
- Individuals between the ages of 26 and 34 are the least likely to have health insurance. Only 84% are covered in Utah.
- By gender, females (91%) are just slightly more likely than males (89%) to maintain health insurance. This may be partially due to the dominance of women in the highly-covered 65-years-and-older group.
- Education shows a high correlation with health insurance coverage. Persons with a bachelor’s degree or higher show the highest coverage rate — 96%. On the other end of the scale, individuals who did not graduate from high school maintained an insured rate of just 68%.
- Not surprisingly, of all labor force statuses, the unemployed are least likely to have health insurance (65%). Interestingly, those not in the labor force (which would include the retired), display an insured rate just slightly lower than the employed. In addition, based on work experience, individuals working full-time, year-round are the most likely group be insured.
- Household income is also a good predictor of health insurance coverage. Those with the highest incomes ($100,000 and over) have the highest coverage rates (95%). In contrast, those with the lowest incomes (under $25,000) have the lowest coverage rates (81%). a
- Latino and Native Americans show the lowest rates of any major ethnic/racial groups. Rates for both sets measure just 73%. White, non-Latino Utahns maintain the highest health insurance coverage shares.
- Only 56% of noncitizens have health insurance in Utah compared to 92 percent of Utahns born in the United States.