By Mark Knold and Lecia Langston
Across the United States, jobs are quantified through each state’s unemployment insurance program. Those programs provide the potential for laid-off workers to receive unemployment benefits — the goal being to bridge the gap between workers’ lost jobs and their next jobs. An eligible recipient’s weekly benefit amount is based upon their earnings from recent work. This begs the question, how does Utah’s unemployment insurance program know how much an individual recently earned while working?
That answer is supplied by all businesses that hire workers, as they must report their employees and pay as mandated by the unemployment insurance laws. Companies identify their individual workers and those workers’ monetary earnings for a calendar quarter. As businesses are identified by their industrial activity and geographic location, it is through the unemployment insurance program that aggregate employment counts by industry and location are calculated.
Yet each state’s profiling of individuals is quite minimal in the unemployment insurance program. The U.S. Census Bureau can bring more light to the overall labor force by supplementing said information with gender, age, race/ethnicity and educational attainment (imputted from American Community Survey responses) for Utah’s labor force.
The Census Bureau packages this information through their Local Employment Dynamics program and makes available said data on its website. Here at the Department of Workforce Services, we recently downloaded and packaged Utah-specific data from said website and summarized it in the attached visualization.
Various data “tabs” are available, presenting Utah’s economy from different angles, ranging from industry shares within the economy to the age-group distributions of the labor force, to gender and race distributions. These labor variables can be viewed for the state as a whole, or by each individual county.
Some statewide highlights:
Industry — industrial distribution is quite diverse, which provides strength within the economy. Distributions do fluctuate with time, with manufacturing seeing its share lessen while health care and professional and business services shares have increased.
Age — the bulk of Utah’s labor force is composed of 25- to 44-year-olds. Older worker shares have increased over the past 15 years, yet still remain a non-dominant portion of Utah’s labor force. The youngest segments of the labor force declined noticeably during the Great Recession due to less participation, and that trend remains.
Educational Attainment — turnover rates are understandably highest with workers under the age of 25 as they strive to build their educational foundation and also find their niche in the labor market. A trend does stand out where the more education that a worker attains, the lower the turnover rate businesses experience from said educational classes.
Race/Ethnicity — Whites account for around 80 percent of Utah’s labor force. The Asian community is small but slowly increasing in share, and is also characterized with the lowest turnover rate and the highest new-hire wages.
Gender — males comprise about 55 percent of Utah’s labor force. The female share of 45 percent is higher than the national average. Roughly 35 percent of working females work part-time compared to 15 percent for males. Therefore, female new-hire wages are considerably lower than male new-hire wages. (Note: employer reporting into the unemployment insurance system is not hourly wage rate reporting but instead total calendar quarter wages paid. Therefore, calculations can only be made upon total quarterly wages, and part-time employment weakens this measure).
Here are some labor highlights for the Central Utah Region:
Variety is the spice of economic life in Utah’s Central Region. Because of their size, Sanpete and Sevier counties do dominate employment trends. However, the “devil is in the details,” and each county presents its own unique labor market flavor in labor. In this post, the Central Region includes Millard, Piute, Sanpete, Sevier and Wayne counties.
From an industry perspective, both manufacturing and construction employment shares declined in Central Utah between 2000 and 2015. On the other hand, mining and health care/social services employment grew in importance. Other industries maintained a comparatively steady employment presence.
Like most other regions across Utah, younger workers have made up a smaller and smaller share of total Central Utah employment over time. In contrast, older workers have increased their share. Part of this change reflects demographic changes. Yes, baby boomers, it really is all about us (even though millennials might think it’s all about them). As baby boomers have aged toward retirement, old workers’ portion of the employment pie has swelled. However, younger people are also not participating in the labor force at the rates they did even just 15 years ago.
In 2000, workers under age 18 made up almost 12 percent of Central Region workers, today they account for less than 7 percent. On the other hand, workers 55 and older also accounted for about 12 percent of workers in 2000, but increased their share to almost 22 percent today. Moreover, the less-populated counties of the Central Region are older in general than their metropolitan cousins. Statewide, only 17 percent of workers are 55 years and older.
Among the general population, educational attainment has steadily increased in Utah. In contrast, LED labor market trends show a somewhat different pattern. Traditionally, educational attainment categorization is applied only to those over 25 years who are more likely to have completed (or mostly completed) their schooling. The shrinking share of young people in the labor market is readily apparent in the educational attainment charts. Statewide, workers under 25 years comprised almost one-third of the employed in 2000 compared to only 21 percent in 2015. The Central Utah Region showed the same pattern.
Excluding workers under 25 years from the statewide educational attainment figures reveals there was actually a slight increase in the portion of the work force with less than a high school education between 2000 and 2015 (from 11 to 13 percent). Central Utah showed a similar trend with a slightly higher share of workers with less than a high school education in 2015 (14 percent). Other educational groups remained relatively stable splitting the difference between themselves.
Why the divergence in educational trends in the population and employment? Demographics may be at work. Older generations generally have less educational attainment than younger generations. As the older worker share of the employment base increases, so does their influence on educational attainment. In addition, the influx of less-educated in-migrants into the workforce during the time frame may have also contributed to the slight rise in the share of workers with less than a high school education.
Central Utah’s employment base is even less racially and ethnically diverse than not-particularly-diverse Utah. For example, 87 percent of Central Utah employment is white, not Hispanic, while Utah displays less than 81 percent in that category. However, these areas manifest the same trends in racial/ethnic diversity. Both Utah and Central Utah workforces showed a higher percentage of minorities over time. In particular, Hispanics/Latinos have shown the largest share gains and represent the largest minority segment.
Millard County
Large building projects in Millard County ballooned construction’s share of total employment at various points in time between 2000 and 2015. These employment surges are even more evident in the hires and separations data. Transportation/utilities and leisure/hospitality services have accounted for smaller employment percentages over the last decade-and-a-half, while professional/business services dramatically increased its portion of total jobs.
Millard County’s employees tend to be even older than those in the region generally. Workers 55 years and older accounted for 26 percent of total employment. Not only do young workers account for a smaller share of the labor force over the past 15 years; but workers in the middle range, 35 to 44 years, have lost ground, down to 21 percent from 26 percent in 2000.
Millard County took an educational hit according to educational attainment trends. The share of Millard County workers with at least a bachelor’s degree declined 3 percentage points between 2000 and 2015, with workers with a high school education or less taking up the slack.
Millard County’s workforce displays a higher percentage of Hispanics/Latinos than the region in general — almost 12 percent of workers are found in this category. The county does have a notable agri-business sector which relies heavily on Hispanic/Latino laborers.
Piute County
In Piute County, industry data is often suppressed to avoid disclosing confidential, firm-level data. This makes tracking trends problematic. However, the prominent role played by public education is evident.
Piute County maintains the oldest population in Utah. This translates into a work force that is also older than average. As elsewhere, the youngest workers accounted for an ever-decreasing portion of employment between 2000 and 2015 ending with a share of only 5 percent in 2015. Workers over the age of 55 accounted for almost a quarter of total nonfarm employment in 2015, the largest share of any Piute County age group.
The portion of the workforce at both ends of the educational attainment continuum increased in Piute County between 2000 and 2015. The share of workers with a bachelor’s degree increased from 11 percent to more than 16 percent. The portion of employees with less than a high school education followed a similar pattern. The workforce share with some college or an associate degree held relatively steady, while the share with a high school education decreased.
Like most other Utah counties, Piute County has seen the Hispanic/Latino portion of its employment increase notably over the last 15 years. Other nonwhite racial/ethnic groups maintained a relatively small portion of the labor force.
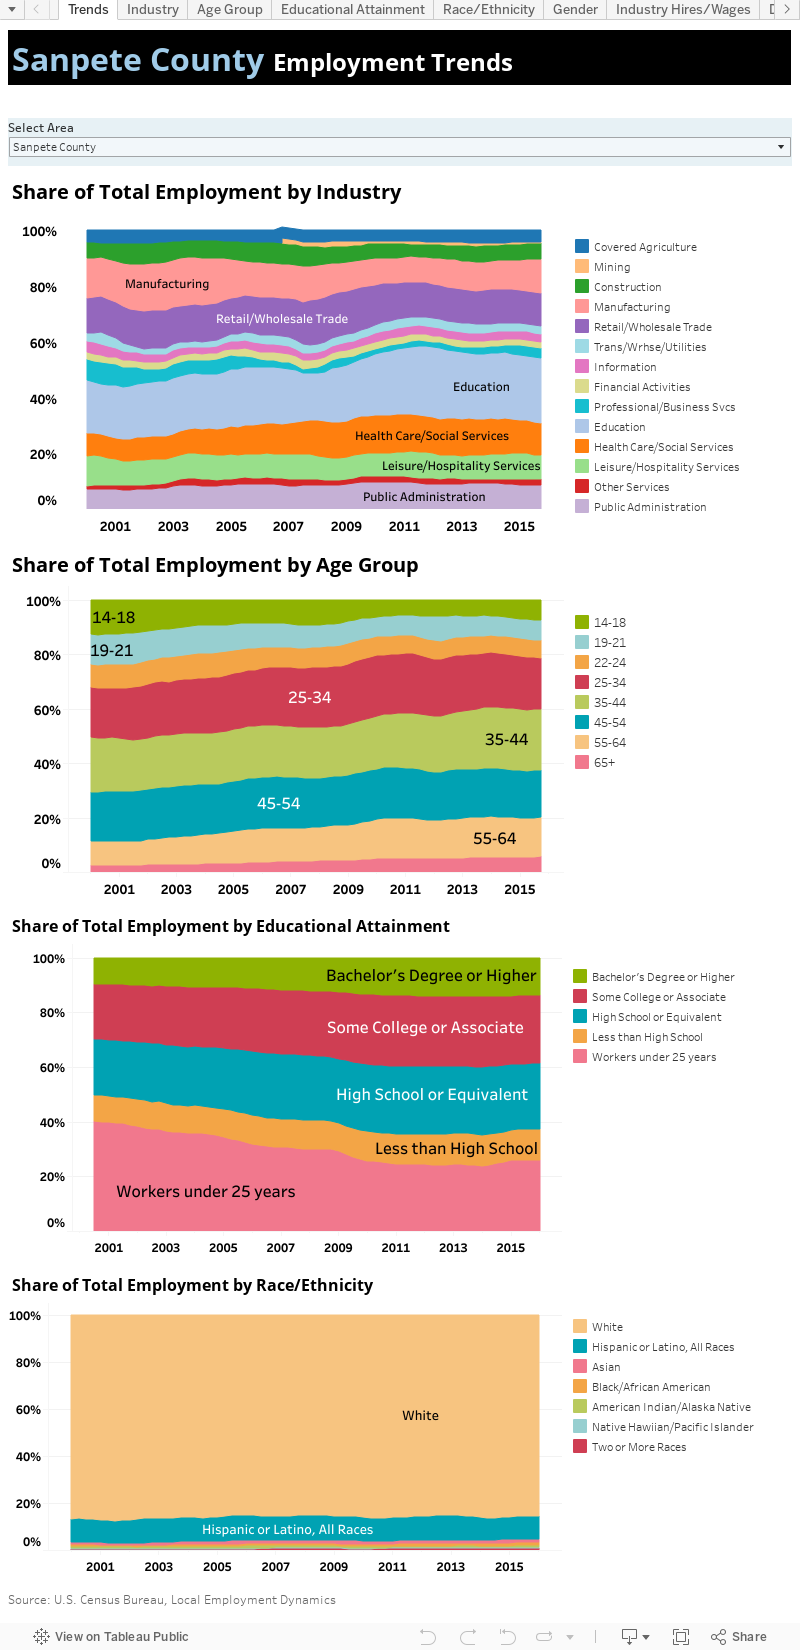
Sanpete County
Although Sanpete has a notable manufacturing sector for its population size, this industry has accounted for a notably smaller share of jobs since the recession. On the other hand, health care and social services have picked up employment shares in the post-recessionary period.
While the age distribution of Sanpete County’s workers followed the general trends of the region, some notable differences stand out. Sanpete County’s workers under 25 make a notably larger segment of employment than do other counties in the region (and statewide as well). Snow College’s role in producing an influx of college-aged workers into the area is certainly the cause.
Sanpete County bucked the state and regional trends when it comes to the educational attainment of employed workers 25 years and older. The segment with less than a high school education actually declined while the percentage with a bachelor’s degree increased from 16 to almost 19 percent.
Unlike other Central Utah counties, Sanpete County’s share of Hispanic/Latino workers has remained relatively constant over time. There does seem to have been a slight influx of this group during the pre-recession boom.
Sevier County
In Sevier County, mining, transportation (which hauls mining’s output) and health care/social services all increased their employment shares between 2000 and 2015. In contrast, manufacturing’s share of employment has declined notably — from more than 9 percent to less than 5 percent. Construction has also lost employment-share ground.
Interestingly, teenagers make up a slightly larger share of employment in Sevier County than they do statewide. On the other hand, Sevier County follows the regional trend of a higher-than-average portion of older workers (55 and older).
The relative educational attainment of Sevier County’s employment base remained quite steady during the 2000 to 2015 time frame. The increase in the portion of those with less than a high school education proved negligible while other groups also maintained roughly the same shares.
Sevier County’s work force is notably less diverse that most other counties in the region. Almost 91 percent of workers are white, non-Hispanic, compared to 87 percent region-wide. A relatively small Hispanic working community (only 5 percent of workers) accounts for this relative lack of diversity.
Wayne County
The loss of Wayne County’s formerly largest employer, Aspen Education Group, is the story in this county’s employment trends. At the industry peak, health care and social services accounted for almost 30 percent of the county’s nonfarm jobs. However, in 2015, health care/social services contributed only 12 percent of total employment. For the most part, the leisure/hospitality services industry has taken up the slack. Its share of employment increased from 20 percent in 2000 compared to roughly 34 percent in 2015. The seasonal nature of this industry is also apparent in its large share of hires and separations.
As elsewhere, teenagers in Wayne County have made up a smaller and smaller piece of the employment pie over time. However, the change has not been as pronounced as the state and regional patterns. Teenagers currently comprise more than 8 percent of county employment compared to only 5 percent statewide. Older Wayne County workers also make up a notably higher portion of jobs than they do statewide.
Wayne County followed the statewide trend in workforce educational attainment. Here, the rise in the share of over-25-year-old workers with less than a high school education was the most pronounced of any county in the region. On the flip side, the percentage of workers with a bachelor’s degree or igher dipped from 21 percent to less than 16 percent in the applicable 15-year period.
Like Sevier County, Wayne County shows an employment base that is less diverse than the rest of the region. Again, a relatively small and stable Hispanic/Latino work force explains the comparative lack of racial/ethnic variation.